
개요
다우 이론 트렌드 적응형 모멘텀 전략은 고전적인 다우 이론 원칙에 기반한 고급 거래 방법으로, 시장 추세의 주요 전환점을 식별하여 거래 결정을 내리는 데 도움을 줍니다. 이 전략은 가격 추세의 기본적인 역학을 감지하고 확인하는 데 중점을 두며, 고점 상승(Higher Highs)과 저점 상승(Higher Lows)을 사용하여 상승 추세를 정의하고, 고점 하락(Lower Highs)과 저점 하락(Lower Lows)을 사용하여 하락 추세를 정의합니다. 이 방법은 시장 추세를 체계적으로 포착하고 추세가 변할 때 신속하게 대응할 수 있는 체계적인 접근 방식을 제공하는 것을 목표로 합니다.
전략 원리
이 전략의 핵심 원리는 고전적인 다우 이론의 추세 식별 방법에 기반합니다. 전략은 ta.pivothigh() 및 ta.pivotlow() 함수를 사용하여 주요 전환점을 감지합니다. 구체적인 구현은 다음과 같은 주요 단계를 포함합니다:
- 전환점 감지:
pivotLookback매개변수를 사용하여 좌우 막대 수를 결정하여 고점과 저점을 식별합니다. - 추세 확인: 상승 추세는 고점 상승과 저점 상승 조건이 동시에 충족될 때만 확인되며, 하락 추세는 고점 하락과 저점 하락 조건이 동시에 충족될 때만 확인됩니다.
- 추세 지속성: 추세 전환 조건이 충족되지 않으면 전략은 이전 추세 상태를 유지하여 더 부드러운 추세 추적을 실현합니다.
전략 장점
- 동적 추세 식별: 주요 전환점을 지속적으로 분석하여 시장 추세 변화를 동적으로 포착할 수 있습니다.
- 유연한 거래 모드: 자동, 롱 전용, 숏 전용의 세 가지 거래 모드를 제공하여 다양한 거래자의 요구를 충족시킵니다.
- 리스크 관리: 내장된 손절 및 이익 실현 메커니즘으로 개별 거래의 위험을 효과적으로 제어할 수 있습니다.
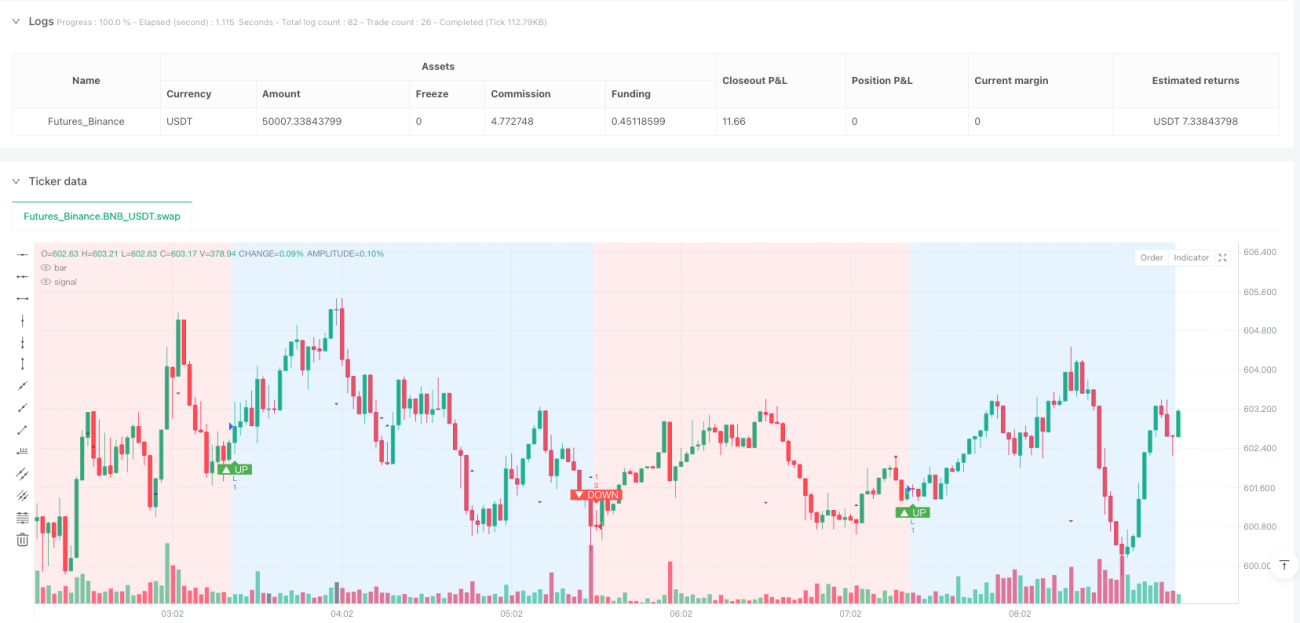
- 추세 시각화: 배경색과 마커를 통해 추세 방향을 직관적으로 표시하여 거래자가 시장 상태를 빠르게 이해할 수 있도록 합니다.
- 낮은 지연 시간: 기존 이동 평균 전략에 비해 이 방법은 추세 변화에 더 빠르게 대응할 수 있습니다.
전략 리스크
- 지연 리스크: 전환점 감지를 사용하기 때문에 전략은 본질적으로 지연 리스크를 지니며, 추세의 초기 신호를 포착하지 못할 수 있습니다.
- 레인징 시장 리스크: 변동이 명확하지 않은 시장에서는 잦은 소규모 가격 변동이 불필요한 거래를 초래할 수 있습니다.
- 매개변수 민감도:
pivotLookback매개변수 선택이 전략 성과에 큰 영향을 미치며, 시장과 시간 프레임에 따라 조정이 필요합니다. - 거래 비용: 잦은 거래는 특히 수수료율이 높은 경우 높은 거래 비용을 초래할 수 있습니다.
전략 최적화 방향
- 추가 필터 도입: 추세 강도 지표(예: ATR)를 결합하여 약한 추세 신호를 필터링합니다.
- 동적 매개변수 조정: 시장 변동성 기반의 적응형
pivotLookback매개변수 메커니즘 개발. - 다중 시간 프레임 검증: 여러 시간 프레임에서 추세 신호를 교차 검증하여 신호 신뢰성을 높입니다.
- 머신러닝 강화: 머신러닝 알고리즘을 활용하여 추세 식별 및 진입 시점 최적화 탐구.
- 리스크 관리 최적화: 시장 변동성에 따라 손절 및 이익 실현 거리를 동적으로 조정합니다.
요약
다우 이론 트렌드 적응형 모멘텀 전략은 강력한 추세 추적 방법으로, 혁신적인 전환점 분석 기술을 통해 거래자에게 체계적인 추세 식별 도구를 제공합니다. 일부 내재된 리스크가 있지만, 그 유연성과 동적 특성은 현대 퀀트 거래 전략에서 가치 있는 접근 방식입니다. 이 전략을 성공적으로 적용하려면 작동 원리를 깊이 이해하고 특정 시장 환경에 따라 지속적인 최적화와 조정이 필요합니다.
Overview
The Dow Theory Trend Adaptive Momentum Strategy is an advanced trading approach based on classic Dow Theory principles, designed to guide trading decisions by identifying key turning points in market trends. The strategy focuses on detecting and confirming the fundamental dynamics of price trends, using Higher Highs and Higher Lows to define uptrends, and Lower Highs and Lower Lows to define downtrends. This method aims to provide a systematic approach to capturing market trends and responding promptly when trends change.
Strategy Principles
The core principle of this strategy is based on the classic Dow Theory trend identification method. The strategy detects key turning points using ta.pivothigh() and ta.pivotlow() functions. Specific implementation includes the following key steps:
- Turning Point Detection: Use the pivotLookback parameter to determine the number of bars on both sides for identifying highs and lows.
- Trend Confirmation: An uptrend is confirmed only when both Higher Highs and Higher Lows conditions are met; similarly, a downtrend is confirmed only when both Lower Highs and Lower Lows conditions are satisfied.
- Trend Persistence: If trend conversion conditions are not met, the strategy maintains the previous trend state, achieving smoother trend tracking.
Strategy Advantages
- Dynamic Trend Identification: By continuously analyzing key turning points, the strategy can dynamically capture market trend changes.
- Flexible Trading Modes: Provides three trading modes - automatic, long-only, and short-only - to meet different traders' needs.
- Risk Management: Built-in stop-loss and take-profit mechanisms effectively control the risk of individual trades.
- Trend Visualization: Intuitively displays trend direction through background colors and markers, making it easy for traders to understand market conditions.
- Low Latency: Compared to traditional moving average strategies, this method can respond to trend changes more quickly.
Strategy Risks
- Lag Risk: Due to using pivot point detection, the strategy inherently carries a lag risk and may not capture the earliest trend signals.
- Ranging Market Risk: In markets with unclear fluctuations, frequent small price changes may lead to unnecessary trades.
- Parameter Sensitivity: The choice of pivotLookback parameter significantly impacts strategy performance and requires adjustment for different markets and timeframes.
- Trading Costs: Frequent trading may result in high transaction costs, especially with higher commission rates.
Strategy Optimization Directions
- 추가 필터 도입: 추세 강도 지표(예: ATR)를 결합하여 약한 추세 신호를 필터링합니다.
- 동적 매개변수 조정: 시장 변동성에 기반한 적응형 pivotLookback 매개변수 메커니즘을 개발합니다.
- 다중 시간대 검증: 서로 다른 시간대에서 추세 신호를 교차 검증하여 신호 신뢰성을 향상시킵니다.
- 머신러닝 강화: 머신러닝 알고리즘을 활용하여 추세 식별 및 진입 타이밍을 최적화하는 방안을 탐구합니다.
- 리스크 관리 최적화: 시장 변동성에 기반하여 손절매 및 이익 실현 거리를 동적으로 조정합니다.
결론
다우 이론 추세 적응형 모멘텀 전략(Dow Theory Trend Adaptive Momentum Strategy)은 강력한 추세 추종 방법으로, 혁신적인 전환점 분석 기법을 통해 트레이더에게 체계적인 추세 식별 도구를 제공합니다. 몇 가지 내재된 위험이 있음에도 불구하고, 그 유연성과 역동성은 현대 퀀트 트레이딩 전략에서 가치 있는 접근 방식으로 자리 잡게 합니다. 이 전략을 성공적으로 적용하려면 작동 원리에 대한 깊은 이해와 특정 시장 환경에 기반한 지속적인 최적화 및 조정이 필요합니다.
/*backtest
start: 2025-03-29 00:00:00
end: 2025-03-30 09:00:00
period: 2m
basePeriod: 2m
exchanges: [{"eid":"Futures_Binance","currency":"BNB_USDT"}]
*/

//@version=5
// strategy(title="Dow Theory Trend Strategy v3", shorttitle="Dow Trend Strat v3", overlay=true,
//      initial_capital=10000, default_qty_type=strategy.percent_of_equity, default_qty_value=10,
// commission_type=strategy.commission.percent, commission_value=0.1, // Example strategy settings with commission- 1