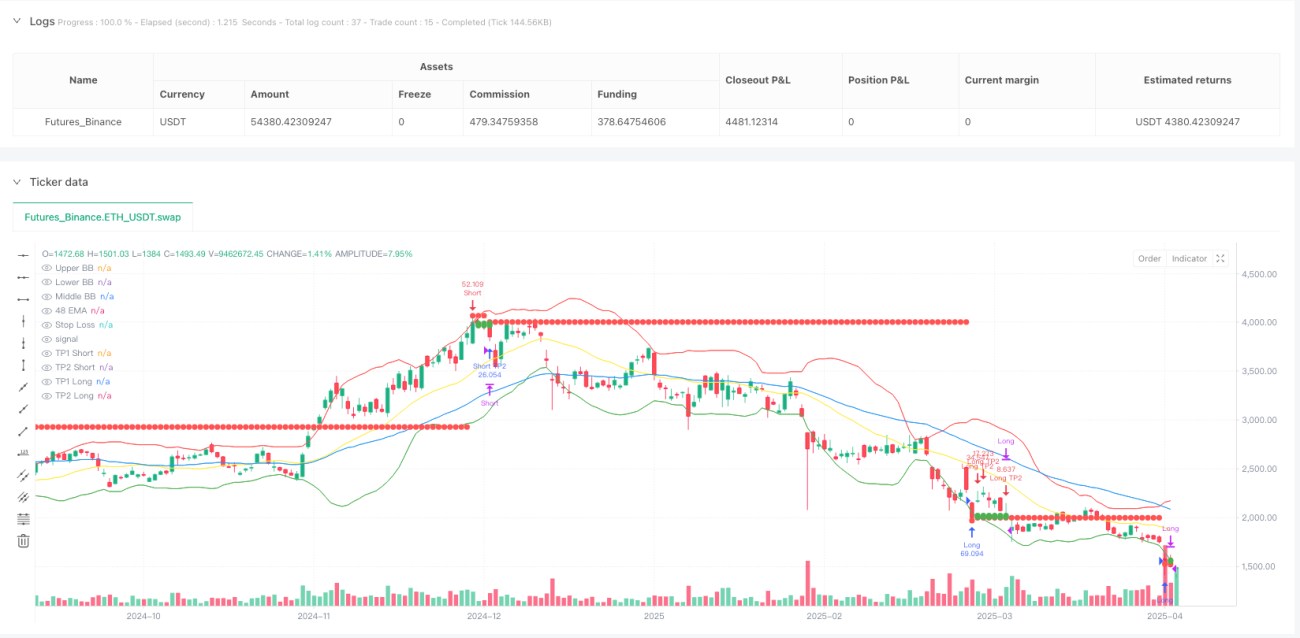
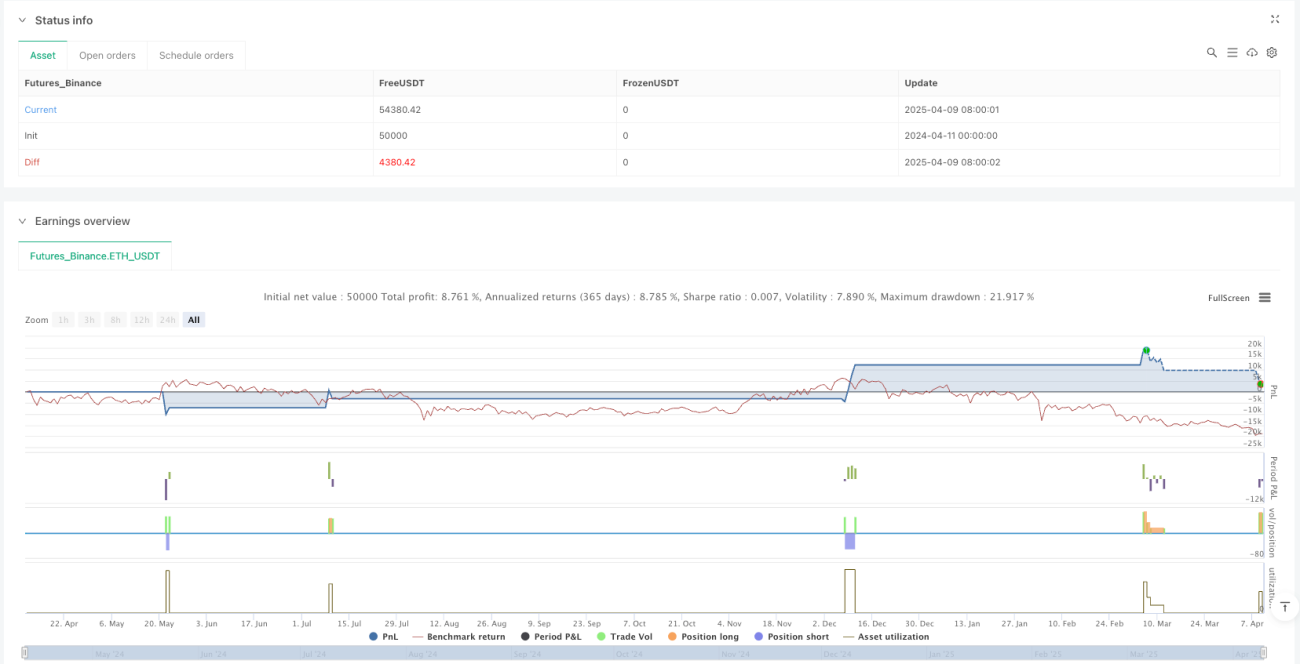
다중 지표 확인 평행선 돌파 DCA 동적 정지 전략은 기술 분석과 달러 비용 평균을 결합한 고급 단선 거래 시스템이다. 이 전략은 EMA 48, RSI 14, MACD 및 브린 벨트와 같은 여러 기술 지표를 사용하여 잠재적인 진입 지점을 확인하며, 구조화된 포지션 관리 방법과 미리 설정된 위험 제어 장치를 구현한다. 전략의 핵심은 가격과 EMA의 교차점을 식별하고 RSI, MACD 및 브린 벨트를 사용하여 확인하고, 높은 시간 프레임 분석과 함께 가짜 신호를 피하고, 3단 DCA 전략을 사용하여 포지션을 가리고, 다단 정지 및 동적 정지 손실을 통해 수익을 보호한다.
이 전략의 원리는 여러 기술 지표의 조합에 기초하고 있으며, 주로 다음과 같은 핵심 구성 요소를 포함합니다.
입시 조건 시스템:
동적 위치 관리:
스마트 수익 메커니즘:
코드 깊이 분석에 따르면, 이 전략에는 지능형 피크 밸리 식별 시스템이 포함되어 있으며, 가격과 RSI의 최근 5 개의 변동점을 추적하여 패턴의 이탈을 감지합니다. 높은 시간 프레임 확인 시스템은 낮 시간 프레임의 가짜 신호를 방지하기 위해 일선 그래프의 지원 및 저항 지점을 분석합니다.
이 전략에 대한 코드에 대해 자세히 살펴보면 다음과 같은 중요한 장점을 찾을 수 있습니다.
다단계 인증 시스템: 여러 기술 지표의 연동으로, 가짜 신호의 가능성을 크게 줄이고 거래의 승률을 높입니다. EMA, RSI, MACD 및 브린 테이프의 조합 사용은 입시 지점의 높은 품질을 보장합니다.
현명한 재무 관리1 - 2 - 6 DCA 비율을 사용하는 방법은 시장의 변동성 평균 비용을 이용하면서도 전반적인 위험 틈을 제한합니다. 초기 위험은 계좌의 1 - 3%로 제한되어 최악의 경우에도 치명적인 손실이 발생하지 않도록합니다.
동적 정지 보호: 거래의 진행에 따라 손해제조가 조정되며, 특히 일부 이익을 취득한 후 손해제조가 보금자리로 이동하여, 이윤을 보호하고 거래의 호흡 공간을 허용하는 필요성을 효과적으로 균형을 맞추고 있습니다.
단계적 수익 전략0.5%와 1%의 수익점에서 각각 25%와 50%의 포지션을 닫음으로써, 전략은 수익의 일부를 잠금하는 동시에 포지션을 유지하여 더 큰 시장 움직임을 포착하고 위험과 수익의 균형을 이룰 수 있습니다.
높은 시간 프레임 확인: 상위 시간 프레임의 지지 및 저항 지점을 사용하여 거래 신호를 필터링하여 낮은 시간 프레임에서 흔히 발생하는 소음 및 가짜 돌파의 영향을 줄입니다.
이 전략은 세심한 설계에도 불구하고 몇 가지 위험 요소가 있습니다.
매개변수 민감도전략의 성능은 EMA 주기와 RSI 경미점 및 DCA 레벨을 포함한 여러 파라미터 설정에 크게 의존합니다. 이러한 파라미터의 미세한 변화는 거래 결과의 눈에 띄는 차이로 이어질 수 있으며 신중한 최적화와 재검토가 필요합니다.
큰 변동의 위험DCA 장치가 있음에도 불구하고, 시장의 급격한 변동이 발생하면 가격이 모든 설정된 스톱 손실 지점을 빠르게 초과하여 예상보다 실제 손실을 초래할 수 있습니다. 이러한 위험에 대해, 더 엄격한 초기 포지션 크기를 사용하거나 높은 변동의 기간 동안 거래를 중단하는 것이 고려 될 수 있습니다.
연속적인 손실의 중첩 효과: 개별 거래의 위험이 제한되어 있더라도, 연속적인 손실은 여전히 자본 곡선의 현저한 하락을 초래할 수 있습니다. 매일 또는 주간 최대 손실 제한과 같은 추가적인 전체적인 위험 제어를 시행하는 것이 좋습니다.
RSI의 복잡성: 코드에서 RSI 이탈의 검사는 역사적 데이터의 정확성에 의존하며, 특정 시장 조건에서 충분히 신뢰할 수 없습니다. 탈피 신호를 확인하기 위해 더 고급 통계 방법을 사용하는 것이 고려 될 수 있습니다.
시장 유동성에 의존하는 것: 유동성이 낮은 시장에서 많은 DCA 주문이 슬라이드 포인트 문제를 겪을 수 있으며, 전략의 전반적인 효율성에 영향을 미칩니다. 이 전략은 유동성이 높은 시장에서 사용하도록 제한해야 합니다.
코드의 심층적인 분석을 바탕으로, 이 전략이 최적화될 수 있는 몇 가지 방향은 다음과 같습니다:
동적 변수 조정: 시장의 변동성에 기반한 동적 변수 조정 메커니즘을 도입할 수 있다. 예를 들어, 높은 변동성 동안 RSI의 하락값을 자동으로 증가시키거나, 다른 시장 주기에 적응하기 위해 EMA의 길이를 조정한다. 이러한 자기 적응 메커니즘은 다양한 시장 환경에서 전략의 안정성을 향상시킬 수 있다.
검출에서 벗어나는 강화: 현재 RSI의 오차 검사는 비교적 간단하며, 더 복잡한 알고리즘을 도입하여 정확도를 높일 수 있습니다. 예를 들어, 피셔 변환 RSI를 사용하거나 트래픽 확인을 추가합니다. 이것은 잘못된 신호를 줄이고 전략의 정확도를 높일 것입니다.
스마트 수익 최적화: 현재 고정된 이득은 시장의 변동성에 기반한 동적 이득으로 개선될 수 있다. 예를 들어, 높은 변동성 동안 더 높은 수익 목표를 설정하고 낮은 변동성 동안 목표를 낮추어 시장 조건의 변화에 적응한다.
재정 관리의 정교화: DCA의 비율과 트리거 포인트를 최적화할 수 있으며, 시장 구조와 현재 트렌드 강도에 따라 동적으로 조정한다. 예를 들어, 강한 트렌드에서 더 급진적인 DCA 비율을 사용하고 약한 트렌드에서는 더 보수적이다.
거래 시간 최적화: 거래량 및 변동성에 기반한 시간 필터를 도입하여 낮은 활동 기간 동안 거래를 피하십시오. 이것은 역사 데이터를 분석하여 최적의 거래 시간 창을 결정함으로써 가능합니다.
다중 지표 확인 평행선 돌파 DCA 다이내믹 스톱 전략은 여러 가지 기술 분석 도구와 첨단 자금 관리 기술을 능숙하게 결합한 잘 설계된 단선 거래 시스템입니다. EMA, RSI, MACD 및 브린 벨트와 같은 지표의 연동 작업을 통해 이 전략은 높은 확률의 진입 지점을 식별 할 수 있으며 구조화된 DCA 방법과 다이내믹 스톱/피드 메커니즘을 사용하여 위험을 관리하고 수익을 잠금합니다.
이 전략은 엄격한 위험 제어, 다단계 인증 시스템 및 지능형 수익 메커니즘을 포함한 명백한 장점이 있지만, 사용자는 여전히 변수 민감성과 시장의 급격한 변동으로 인한 위험을 경계해야합니다. 동적 변수 조정, 역행성 검출 및 지능형 수익 최적화 강화와 같은 권장 된 최적화 조치를 시행함으로써 이 전략의 안정성과 수익성이 더욱 향상 될 것으로 예상됩니다.
트레이더들에게, 이 전략은 충분한 유동성이 있는 시장에 적용하기에 가장 적합하며, 사용하기 전에 충분한 역사 회귀와 변수 최적화가 이루어져야 한다. 신중한 구현과 지속적인 모니터링 조정으로, 이 다층 거래 시스템은 짧은 라인 트레이더의 도구 상자에 강력한 무기가 될 수 있다.
/*backtest
start: 2024-04-11 00:00:00
end: 2025-04-10 00:00:00
period: 1d
basePeriod: 1d
exchanges: [{"eid":"Futures_Binance","currency":"ETH_USDT"}]
*/
//@version=6
strategy("Scalping Strategy with DCA - V2", overlay=true, margin_long=100, margin_short=100)
// Input parameters
emaLength = input.int(48, title="EMA Length", minval=1, group="Main Indicators")
rsiLength = input.int(14, title="RSI Length", minval=1, group="Main Indicators")
macdShortLength = input.int(12, title="MACD Short Length", minval=1, group="Main Indicators")
macdLongLength = input.int(30, title="MACD Long Length", minval=1, group="Main Indicators")
macdSignalLength = input.int(9, title="MACD Signal Length", minval=1, group="Main Indicators")
bbLength = input.int(20, title="Bollinger Bands Length", group="Main Indicators")
bbMult = input.float(2.0, title="Bollinger Bands Multiplier", group="Main Indicators")
// Risk management parameters
initialRiskPercent = input.float(1.0, title="Initial Risk % of Account", minval=0.1, maxval=3.0, step=0.1, group="Risk Management")
stopLossPercent = input.float(1.5, title="Stop Loss % (Unboosted)", minval=0.5, maxval=3.0, step=0.1, group="Risk Management")
fixedSLPercent = input.float(1.3, title="Fixed SL % after full DCA", minval=0.1, maxval=5.0, step=0.1, group="Risk Management")
takeProfitPercent1 = input.float(0.5, title="First Take Profit % (25% Volume)", minval=0.1, group="Risk Management")
takeProfitPercent2 = input.float(1.0, title="Second Take Profit % (50% Volume)", minval=0.1, group="Risk Management")
// DCA parameters
enableDCA = input.bool(true, title="Enable DCA", group="DCA Settings")
dcaLevel1 = input.float(1.0, title="DCA Level 1 % Drop", minval=0.1, group="DCA Settings")
dcaLevel2 = input.float(2.0, title="DCA Level 2 % Drop", minval=0.1, group="DCA Settings")
// Higher Timeframe parameters
higherTF = input.timeframe("D", title="Higher Timeframe for Confirmation", group="Advanced Settings")
useHTFConfirmation = input.bool(true, title="Use Higher Timeframe Confirmation", group="Advanced Settings")
// Debug parameters
showLabels = input.bool(true, title="Show Entry/Exit Labels", group="Visual")
showSL = input.bool(true, title="Show Stop Loss Lines", group="Visual")
showTP = input.bool(true, title="Show Take Profit Lines", group="Visual")
// Calculate indicators
ema = ta.ema(close, emaLength)
rsi = ta.rsi(close, rsiLength)
[macdLine, signalLine, _] = ta.macd(close, macdShortLength, macdLongLength, macdSignalLength)
[middle, upper, lower] = ta.bb(close, bbLength, bbMult)
// Variables for tracking peaks and troughs
var priceHighs = array.new_float(0)
var priceLows = array.new_float(0)
var rsiHighs = array.new_float(0)
var rsiLows = array.new_float(0)
// Track last 5 peaks and troughs for both price and RSI
pivot_high = ta.pivothigh(high, 2, 2)
if not na(pivot_high)
array.push(priceHighs, pivot_high)
if array.size(priceHighs) > 5
array.shift(priceHighs)
pivot_low = ta.pivotlow(low, 2, 2)
if not na(pivot_low)
array.push(priceLows, pivot_low)
if array.size(priceLows) > 5
array.shift(priceLows)
rsi_pivot_high = ta.pivothigh(rsi, 2, 2)
if not na(rsi_pivot_high)
array.push(rsiHighs, rsi_pivot_high)
if array.size(rsiHighs) > 5
array.shift(rsiHighs)
rsi_pivot_low = ta.pivotlow(rsi, 2, 2)
if not na(rsi_pivot_low)
array.push(rsiLows, rsi_pivot_low)
if array.size(rsiLows) > 5
array.shift(rsiLows)
// Check for RSI divergence
rsiDivergenceBullish = array.size(priceLows) >= 5 and array.size(rsiLows) >= 5 and array.get(priceLows, array.size(priceLows) - 1) < array.get(priceLows, array.size(priceLows) - 5) and array.get(rsiLows, array.size(rsiLows) - 1) > array.get(rsiLows, array.size(rsiLows) - 5)
rsiDivergenceBearish = array.size(priceHighs) >= 5 and array.size(rsiHighs) >= 5 and array.get(priceHighs, array.size(priceHighs) - 1) > array.get(priceHighs, array.size(priceHighs) - 5) and array.get(rsiHighs, array.size(rsiHighs) - 1) < array.get(rsiHighs, array.size(rsiHighs) - 5)
// Check if price is near previous high/low (Rule #4)
isNearPrevHigh = array.size(priceHighs) >= 2 and math.abs(high - array.get(priceHighs, array.size(priceHighs) - 2)) / array.get(priceHighs, array.size(priceHighs) - 2) < 0.01
isNearPrevLow = array.size(priceLows) >= 2 and math.abs(low - array.get(priceLows, array.size(priceLows) - 2)) / array.get(priceLows, array.size(priceLows) - 2) < 0.01
// Higher timeframe confirmation (Rule #10)
// Get pivot points from higher timeframe
htf_is_pivot_low = request.security(syminfo.tickerid, higherTF, not na(ta.pivotlow(low, 2, 2)), barmerge.gaps_off, barmerge.lookahead_off)
htf_is_pivot_high = request.security(syminfo.tickerid, higherTF, not na(ta.pivothigh(high, 2, 2)), barmerge.gaps_off, barmerge.lookahead_off)
// Count pivots in higher timeframe to check if this is the 2nd pivot
var htf_pivot_low_count = 0
var htf_pivot_high_count = 0
if htf_is_pivot_low
htf_pivot_low_count := htf_pivot_low_count + 1
htf_pivot_low_count := math.min(htf_pivot_low_count, 10) // Prevent unlimited counting
if htf_is_pivot_high
htf_pivot_high_count := htf_pivot_high_count + 1
htf_pivot_high_count := math.min(htf_pivot_high_count, 10) // Prevent unlimited counting
// Reset counts after a while to maintain relevance
if not htf_is_pivot_low and not htf_is_pivot_high and bar_index % 100 == 0
htf_pivot_low_count := 0
htf_pivot_high_count := 0
// Check if this is the 2nd pivot in higher timeframe
isHTFSecondPivotLow = htf_is_pivot_low and htf_pivot_low_count == 2
isHTFSecondPivotHigh = htf_is_pivot_high and htf_pivot_high_count == 2
// Check crossing of Bollinger Bands
crossUpperBand = ta.crossover(close, upper)
crossLowerBand = ta.crossunder(close, lower)
// Entry conditions refined with higher timeframe confirmation
longCondition = close > ema and close[1] <= ema[1] and rsi > 60 and macdLine > signalLine and isNearPrevLow and rsiDivergenceBullish and (not useHTFConfirmation or isHTFSecondPivotLow)
shortCondition = close < ema and close[1] >= ema[1] and rsi < 40 and macdLine < signalLine and isNearPrevHigh and rsiDivergenceBearish and (not useHTFConfirmation or isHTFSecondPivotHigh)
// Additional entry conditions when price crosses Bollinger Bands (Rule #11)
longBBCondition = crossLowerBand and rsi < 30
shortBBCondition = crossUpperBand and rsi > 70
// Calculate position sizes for DCA
initialSize = strategy.equity * initialRiskPercent / 100 / 9 // Initial sizing according to the 1-2-6 rule
dca1Size = initialSize * 2
dca2Size = initialSize * 6
// Calculate SL in money terms (Rule #3)
slMoneyAmount = strategy.equity * initialRiskPercent / 100 * stopLossPercent / 100
// Variables to track DCA levels
var float longEntryPrice = 0.0
var float shortEntryPrice = 0.0
var int longDCACount = 0
var int shortDCACount = 0
var float stopLossLevel = 0.0
var float takeProfit1Level = 0.0
var float takeProfit2Level = 0.0
var float slMoneyValue = 0.0
// Close partial positions at take profit levels
if strategy.position_size > 0
if close >= takeProfit1Level and takeProfit1Level > 0 and strategy.position_size == initialSize + (longDCACount > 0 ? dca1Size : 0) + (longDCACount > 1 ? dca2Size : 0)
strategy.order("Long TP1", strategy.short, qty=strategy.position_size * 0.25)
if showLabels
label.new(bar_index, high, "TP1 (25%)", color=color.green, textcolor=color.white, style=label.style_label_down)
if close >= takeProfit2Level and takeProfit2Level > 0 and strategy.position_size > initialSize * 0.25
strategy.order("Long TP2", strategy.short, qty=strategy.position_size * 0.5)
stopLossLevel := longEntryPrice // Move SL to breakeven after TP2
if showLabels
label.new(bar_index, high, "TP2 (50%) & SL→BE", color=color.green, textcolor=color.white, style=label.style_label_down)
if strategy.position_size < 0
if close <= takeProfit1Level and takeProfit1Level > 0 and math.abs(strategy.position_size) == initialSize + (shortDCACount > 0 ? dca1Size : 0) + (shortDCACount > 1 ? dca2Size : 0)
strategy.order("Short TP1", strategy.long, qty=math.abs(strategy.position_size) * 0.25)
if showLabels
label.new(bar_index, low, "TP1 (25%)", color=color.red, textcolor=color.white, style=label.style_label_up)
if close <= takeProfit2Level and takeProfit2Level > 0 and math.abs(strategy.position_size) > initialSize * 0.25
strategy.order("Short TP2", strategy.long, qty=math.abs(strategy.position_size) * 0.5)
stopLossLevel := shortEntryPrice // Move SL to breakeven after TP2
if showLabels
label.new(bar_index, low, "TP2 (50%) & SL→BE", color=color.red, textcolor=color.white, style=label.style_label_up)
// DCA Logic
if enableDCA and strategy.position_size > 0 and longDCACount < 2
if close < longEntryPrice * (1 - dcaLevel1/100) and longDCACount == 0
strategy.entry("Long DCA1", strategy.long, qty=dca1Size)
longDCACount := 1
if showLabels
label.new(bar_index, low, "DCA1", color=color.blue, textcolor=color.white, style=label.style_label_up)
if close < longEntryPrice * (1 - dcaLevel2/100) and longDCACount == 1
strategy.entry("Long DCA2", strategy.long, qty=dca2Size)
longDCACount := 2
// Update SL to fixed percentage after full DCA (Rule #6)
stopLossLevel := longEntryPrice * (1 - fixedSLPercent/100)
if showLabels
label.new(bar_index, low, "DCA2 & SL Update", color=color.blue, textcolor=color.white, style=label.style_label_up)
if enableDCA and strategy.position_size < 0 and shortDCACount < 2
if close > shortEntryPrice * (1 + dcaLevel1/100) and shortDCACount == 0
strategy.entry("Short DCA1", strategy.short, qty=dca1Size)
shortDCACount := 1
if showLabels
label.new(bar_index, high, "DCA1", color=color.purple, textcolor=color.white, style=label.style_label_down)
if close > shortEntryPrice * (1 + dcaLevel2/100) and shortDCACount == 1
strategy.entry("Short DCA2", strategy.short, qty=dca2Size)
shortDCACount := 2
// Update SL to fixed percentage after full DCA (Rule #6)
stopLossLevel := shortEntryPrice * (1 + fixedSLPercent/100)
if showLabels
label.new(bar_index, high, "DCA2 & SL Update", color=color.purple, textcolor=color.white, style=label.style_label_down)
// Entry with initial position
if longCondition or longBBCondition
strategy.close("Short")
strategy.entry("Long", strategy.long, qty=initialSize)
longEntryPrice := close
longDCACount := 0
shortDCACount := 0
// Set SL based on money value (not percentage)
slMoneyValue := slMoneyAmount
// Convert to price level - simplified version
stopLossLevel := close * (1 - stopLossPercent/100)
takeProfit1Level := close * (1 + takeProfitPercent1/100)
takeProfit2Level := close * (1 + takeProfitPercent2/100)
if showLabels
label.new(bar_index, low, "LONG", color=color.green, textcolor=color.white, style=label.style_label_up)
if shortCondition or shortBBCondition
strategy.close("Long")
strategy.entry("Short", strategy.short, qty=initialSize)
shortEntryPrice := close
longDCACount := 0
shortDCACount := 0
// Set SL based on money value (not percentage)
slMoneyValue := slMoneyAmount
// Convert to price level - simplified version
stopLossLevel := close * (1 + stopLossPercent/100)
takeProfit1Level := close * (1 - takeProfitPercent1/100)
takeProfit2Level := close * (1 - takeProfitPercent2/100)
if showLabels
label.new(bar_index, high, "SHORT", color=color.red, textcolor=color.white, style=label.style_label_down)
// Stop Loss
if strategy.position_size > 0 and low <= stopLossLevel
strategy.close("Long")
if showLabels
label.new(bar_index, low, "SL", color=color.red, textcolor=color.white, style=label.style_label_up)
if strategy.position_size < 0 and high >= stopLossLevel
strategy.close("Short")
if showLabels
label.new(bar_index, high, "SL", color=color.red, textcolor=color.white, style=label.style_label_down)
// Market cap and holder % check can't be done directly in TradingView, but we display a reminder
if strategy.position_size != 0 and bar_index % 100 == 0
label.new(bar_index, close, "Remember: Only trade coins with large market cap and >7% holder ratio",
color=color.yellow, textcolor=color.black, style=label.style_label_left)
// Plot indicators - these must be at the global scope in Pine Script v6
plot(ema, color=color.blue, title="48 EMA")
plot(upper, color=color.red, title="Upper BB")
plot(lower, color=color.green, title="Lower BB")
plot(middle, color=color.yellow, title="Middle BB")
// Plot stop loss and take profit levels - conditions need to be part of the plot function in v6
plotSL = showSL and stopLossLevel > 0 ? stopLossLevel : na
plot(plotSL, color=color.red, style=plot.style_circles, linewidth=2, title="Stop Loss")
// TP for long positions
plotTP1Long = showTP and strategy.position_size > 0 and takeProfit1Level > 0 ? takeProfit1Level : na
plot(plotTP1Long, color=color.green, style=plot.style_circles, linewidth=1, title="TP1 Long")
plotTP2Long = showTP and strategy.position_size > 0 and takeProfit2Level > 0 ? takeProfit2Level : na
plot(plotTP2Long, color=color.green, style=plot.style_circles, linewidth=2, title="TP2 Long")
// TP for short positions
plotTP1Short = showTP and strategy.position_size < 0 and takeProfit1Level > 0 ? takeProfit1Level : na
plot(plotTP1Short, color=color.green, style=plot.style_circles, linewidth=1, title="TP1 Short")
plotTP2Short = showTP and strategy.position_size < 0 and takeProfit2Level > 0 ? takeProfit2Level : na
plot(plotTP2Short, color=color.green, style=plot.style_circles, linewidth=2, title="TP2 Short")
// Additional table with strategy information
if barstate.islastconfirmedhistory
var table infoTable = table.new(position=position.top_right, columns=2, rows=5, bgcolor=color.new(color.black, 70), frame_width=1)
table.cell(infoTable, 0, 0, "Strategy:", bgcolor=color.new(color.blue, 90), text_color=color.white)
table.cell(infoTable, 1, 0, "Scalping with DCA", text_color=color.white)
table.cell(infoTable, 0, 1, "Initial Risk:", bgcolor=color.new(color.blue, 90), text_color=color.white)
table.cell(infoTable, 1, 1, str.tostring(initialRiskPercent, "#.##") + "% of account", text_color=color.white)
table.cell(infoTable, 0, 2, "DCA Ratio:", bgcolor=color.new(color.blue, 90), text_color=color.white)
table.cell(infoTable, 1, 2, "1-2-6", text_color=color.white)
table.cell(infoTable, 0, 3, "SL After DCA:", bgcolor=color.new(color.blue, 90), text_color=color.white)
table.cell(infoTable, 1, 3, str.tostring(fixedSLPercent, "#.##") + "%", text_color=color.white)
table.cell(infoTable, 0, 4, "REMINDERS:", bgcolor=color.new(color.red, 90), text_color=color.white)
table.cell(infoTable, 1, 4, "Only trade coins with market cap and >7% holder ratio", text_color=color.white)