헤이켄 아시 추세 추종 전략: 다중 레벨 손절 메커니즘의 다중 시간 프레임 추세 식별 시스템

개요
헤이켄 아시 추세 추종 전략은 헤이켄 아시 캔들, 슈퍼 트렌드 지표, 평균 방향성 지수(ADX) 필터의 장점을 결합한 종합적인 거래 시스템으로, 강력한 추세 움직임을 식별하고 효과적인 자금 관리를 수행하는 데 목적이 있습니다. 이 전략은 확립된 추세 내에서의 모멘텀을 포착하는 동시에, 고급 3중 손절 메커니즘을 사용하여 자금을 보호하고 이익을 고정합니다. 본 전략은 다양한 거래 종목에 적용 가능하며, 특히 변동성이 큰 시장에서 뛰어난 성과를 보입니다.
전략 원리
헤이켄 아시 추세 추종 전략은 세 가지 핵심 기술 지표의 시너지 효과에 기반합니다.
-
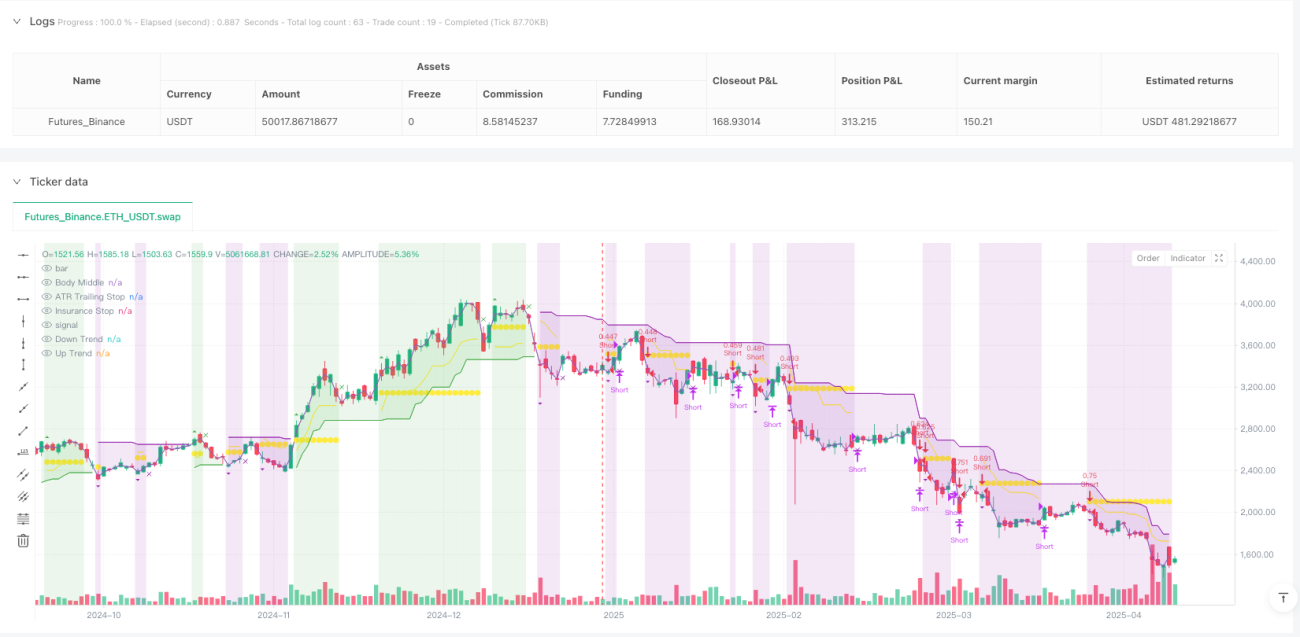
헤이켄 아시 캔들 분석: 이 전략은 위아래 꼬리가 거의 없는 ‘실체’ 헤이켄 아시 캔들에 특히 주목합니다. 이러한 캔들은 가격이 한 방향으로 단호하게 움직이며 거의 되돌림이 없음을 나타내며, 강한 모멘텀과 추세 지속을 암시합니다. 아래꼬리가 없는 녹색 캔들은 롱 신호로, 위꼬리가 없는 빨간색 캔들은 숏 신호로 간주됩니다.
-
슈퍼 트렌드 지표 필터링: 시스템은 슈퍼 트렌드 지표(기본값: 3.0, ATR 기간: 10)를 사용하여 잠재적인 추세 방향을 확인합니다. 진입 신호는 슈퍼 트렌드 방향과 일치해야 하며, 이는 신호의 신뢰성을 높이고 잘못된 거래를 줄여줍니다.
-
ADX 필터(선택 사항): 평균 방향성 지수는 추세 강도를 평가하는 데 사용되며, ADX가 지정된 임계값(기본값: 25)을 초과할 때만 거래가 실행됩니다. 이는 변동성이 낮거나 횡보하는 시장에서의 노이즈 신호를 걸러내는 데 도움이 됩니다.
거래 시스템은 명확한 진입 및 청산 규칙을 가지고 있습니다.
- 진입 신호: 다음 조건이 충족될 때 형성됩니다. (1) 아래꼬리가 없는 녹색 헤이켄 아시 캔들(롱) 또는 위꼬리가 없는 빨간색 헤이켄 아시 캔들(숏), (2) 슈퍼 트렌드 방향 확인, (3) ADX 임계값(활성화된 경우).
- 청산 신호: 반대 방향의 꼬리 없는 캔들이 나타나거나, 손절 메커니즘 중 하나가 작동하면 거래가 종료됩니다.
이 전략의 가장 두드러진 특징은 혁신적인 3중 손절 시스템입니다.
- ATR 트레일링 스탑: 시장 변동성(ATR 값)에 기반하여 손절 위치를 동적으로 조정하며, 추세가 진행됨에 따라 이익을 고정합니다.
- 스윙 포인트 손절: 시장의 자연스러운 구조(회고 기간 내 최근 고점/저점)를 활용하여 손절 위치를 설정하며, 시장 자체의 리듬을 존중합니다.
- 보험 손절: 진입 가격 대비 백분율로 설정된 안전망으로, 즉각적인 자본 보호를 제공합니다. 특히 스윙 포인트 손절 위치가 진입점에서 너무 멀리 떨어져 있을 때 유용합니다.
전략 장점
-
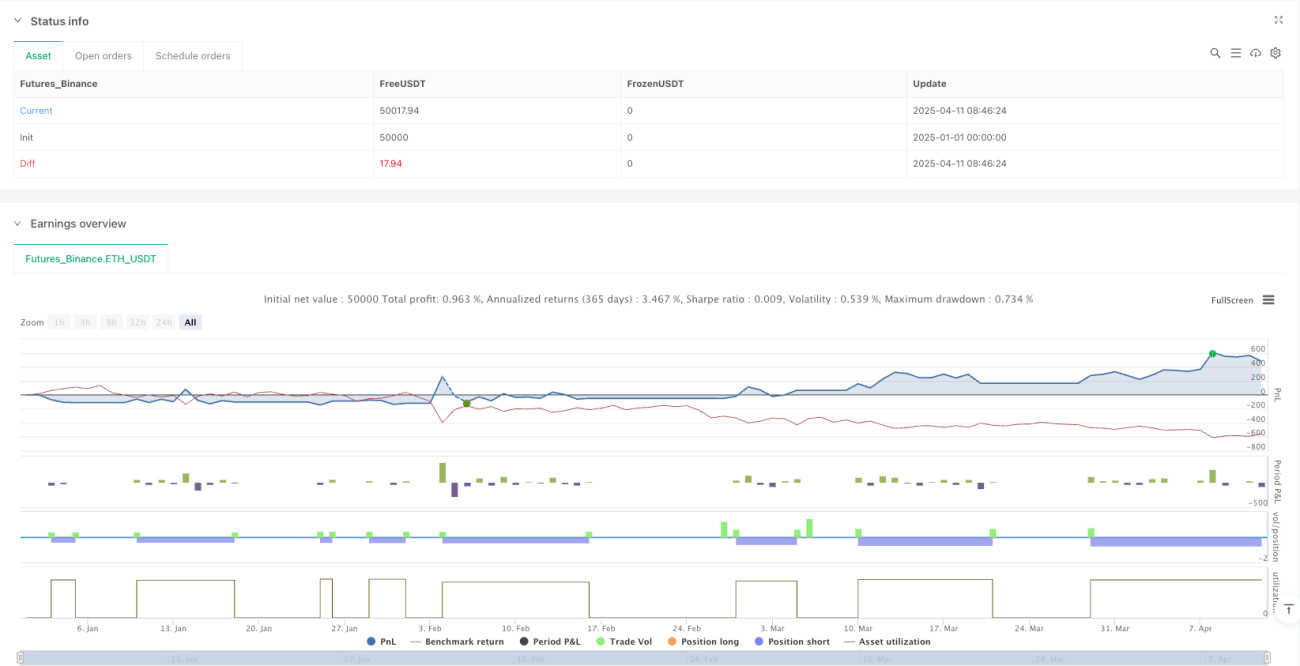
다층 위험 관리: 3중 손절 시스템은 다양한 시장 상황과 위험 시나리오에 적응하는 포괄적인 자금 보호를 제공하며, 이는 이 전략의 가장 두드러진 장점입니다.
-
적응성: 모든 구성 요소(슈퍼 트렌드, ADX)는 시장 조건에 따라 활성화/비활성화할 수 있으며 파라미터도 조정 가능하여 높은 유연성을 제공합니다.
-
강력한 추세 포착 능력: 헤이켄 아시 캔들의 명확한 시각적 신호, 슈퍼 트렌드의 확인, ADX의 추세 강도 평가를 결합하여 강력한 추세 움직임을 효과적으로 식별합니다.
-
명확한 시각적 피드백: 전략은 차트에 포지션 상태, 진입 가격, 현재 손절 수준을 표시하여 트레이더가 전략 실행을 직관적으로 이해하고 추적할 수 있게 합니다.
-
내장된 자금 관리: 전략은 자본금 비율 기반 포지션 관리 방법(기본값: 3%)을 사용하여 계좌 규모 변화에 따라 일관된 위험 노출을 보장합니다.
-
완전한 거래 시스템: 진입 신호부터 청산 규칙까지 완전한 거래 프로세스를 제공하며, 추가적인 의사 결정이나 지표가 필요하지 않습니다.
전략 리스크
-
과적합 위험: 전략에는 여러 조정 가능한 파라미터가 포함되어 있어, 과거 데이터에서는 좋은 성과를 보이지만 실시간 거래에서는 효과가 떨어지는 커브 피팅 문제가 발생할 수 있습니다. 해결 방법은 충분히 긴 기간의 과거 데이터를 사용하여 백테스팅하고 다양한 시장 조건에서 전략의 견고성을 테스트하는 것입니다.
-
추세 반전 위험: 다층 손절 메커니즘에도 불구하고, 강력한 추세가 갑자기 반전될 때 이 전략은 큰 하락을 겪을 수 있습니다. 시장의 갑작스러운 극단적 변동으로 인해 손절이 제때 작동하지 않아 예상치 못한 손실이 발생할 수 있습니다. 해결 방법은 변동성 필터를 추가하거나 더 엄격한 위험 관리 규칙을 구현하는 것입니다.
-
파라미터 민감도: 특히 슈퍼 트렌드 팩터와 ADX 임계값에서 파라미터 설정에 따라 결과가 크게 달라질 수 있습니다. 이는 트레이더가 각 파라미터의 영향을 깊이 이해하고 특정 시장 환경에 적합한 균형점을 찾아야 함을 의미합니다.
-
저변동성 환경에서의 부진한 성과: 변동성이 낮거나 횡보하는 시장에서 이 전략은 여러 번의 잘못된 신호를 생성하여 ‘톱니 거래’를 초래할 수 있습니다. 해결 방법은 이러한 환경에서 거래를 중단하거나 추가적인 시장 환경 필터를 추가하는 것입니다.
-
자금 관리 위험: 고정 비율의 포지션 관리는 모든 시장 환경에 적합하지 않을 수 있으며, 변동성이 큰 시장에서는 위험을 통제하기 위해 포지션 크기를 줄여야 할 수도 있습니다.
전략 최적화 방향
-
변동성 적응 메커니즘 추가: 현재 전략은 역사적 변동성(HV) 또는 내재 변동성(IV) 지표와 같은 변동성 필터를 도입하여 다양한 시장 환경에서 파라미터를 자동으로 조정함으로써 추가 최적화가 가능합니다. 이는 전략이 고변동성 및 저변동성 기간 모두에서 안정적인 성과를 유지할 수 있게 합니다.
-
시간 필터 통합: 변동성이 낮거나 시장 추세가 약한 시간대에 거래를 피하기 위해 시간 기반 필터를 추가하는 것을 고려합니다. 이는 특정 종목을 거래할 때 특히 유용하며, 각 종목은 하루 중 다른 시간대에 다른 행동 특성을 보이기 때문입니다.
-
머신러닝 최적화 도입: 정적 파라미터 설정에 의존하는 대신, 머신러닝 기술을 사용하여 최적의 파라미터 조합을 자동으로 식별할 수 있습니다. 이는 과거 데이터의 패턴을 분석하여 특정 미래 시장 조건에서 어떤 파라미터 설정이 가장 좋은 성과를 낼지 예측함으로써 가능합니다.
-
관련 시장 필터 추가: 관련 시장이나 지수의 행동을 관찰하여 진입 신호를 강화합니다. 예를 들어 특정 종목을 거래할 때 전체 시장 추세나 관련 시장의 강도를 고려하는 것입니다.
-
손절 메커니즘 최적화: 현재의 3중 손절 시스템은 변동성에 따라 보험 손절 비율을 동적으로 조정하거나, 단순한 회고 기간 고점/저점 대신 지지/저항 수준을 사용하여 스윙 포인트 손절을 정밀하게 설정하는 등 추가 최적화가 가능합니다.
-
거래량 분석 통합: 신호 확인 과정에 거래량 필터를 추가하여 가격 움직임이 충분한 거래량에 의해 뒷받침되도록 함으로써 신호의 신뢰성을 높입니다.
요약
헤이켄 아시 추세 추종 전략은 헤이켄 아시 캔들, 슈퍼 트렌드 지표, ADX 필터의 독특한 조합을 통해 강한 추세 내에서 모멘텀 기회를 포착하는 데 집중하는 복잡하고 포괄적인 거래 시스템입니다. 3중 손절 시스템은 전반적인 위험 관리를 제공하며, 맞춤형 파라미터 설정을 통해 다양한 시장 조건에 적응할 수 있습니다.
이 전략의 주요 장점은 명확한 시각적 신호, 강력한 추세 인식 능력, 포괄적인 자금 보호 메커니즘에 있습니다. 그러나 트레이더는 파라미터 최적화의 과제와 저변동성 환경에서의 잠재적 한계를 인식해야 합니다.
변동성 적응 메커니즘 추가, 시간 필터 및 거래량 분석 통합과 같은 제안된 최적화 방향을 구현함으로써 전략의 견고성과 적응성을 더욱 강화할 수 있습니다. 궁극적으로 헤이켄 아시 추세 추종 전략은 기술적 분석의 명확한 신호와 체계적인 위험 관리 원칙을 결합한 균형 잡힌 접근 방식을 대표하며, 추세 추종 트레이더에게 귀중한 도구를 제공합니다.
/*backtest
start: 2025-01-01 00:00:00
end: 2025-04-12 08:00:00
period: 1d
basePeriod: 1d
exchanges: [{"eid":"Futures_Binance","currency":"ETH_USDT"}]
*/

//@version=5
strategy("Heiken Ashi Supertrend ADX - Strategy", overlay=true, initial_capital=1000, commission_type=strategy.commission.percent, commission_value=0, calc_on_every_tick=true, process_orders_on_close=false, default_qty_type=strategy.percent_of_equity, default_qty_value=3)
- 1