RSI 동적 다이버전스 퀀트 전략

2
Follow
502
Followers
개요
RSI 이중 피봇 다이버전스 퀀트 전략은 가격 움직임과 상대강도지수(RSI) 간의 일반적인 강세 및 약세 다이버전스를 감지하여 잠재적인 반전 기회를 식별하는 고급 트레이딩 전략입니다. 이 전략은 자동화된 피봇 포인트 감지 알고리즘을 사용하며, 두 가지 다른 손절/이익실현 관리 방법을 결합하여 다이버전스 신호가 확인되면 자동으로 포지션을 설정합니다. 전략의 핵심은 정확한 수학적 계산을 통해 가격과 RSI 지표 간의 다이버전스 현상을 검증하고, 동적 위험 관리 메커니즘을 통해 모든 거래가 사전 설정된 위험-보상 비율을 따르도록 하는 데 있습니다.
전략 원리
- RSI 계산 모듈: Wilder 평활화 방법을 사용하여 14기간(조정 가능) RSI 값을 계산하며, 종가를 기본 입력 소스로 사용합니다(설정 가능).
- 피봇 포인트 감지:
- 좌우 각 5기간(조정 가능)의 슬라이딩 윈도우를 사용하여 RSI 지표의 국지적 고점과 저점을 감지합니다.
ta.barssince함수를 통해 피봇 포인트 간격이 5~60개 캔들(조정 가능 범위)이 되도록 보장합니다.
- 다이버전스 확인 로직:
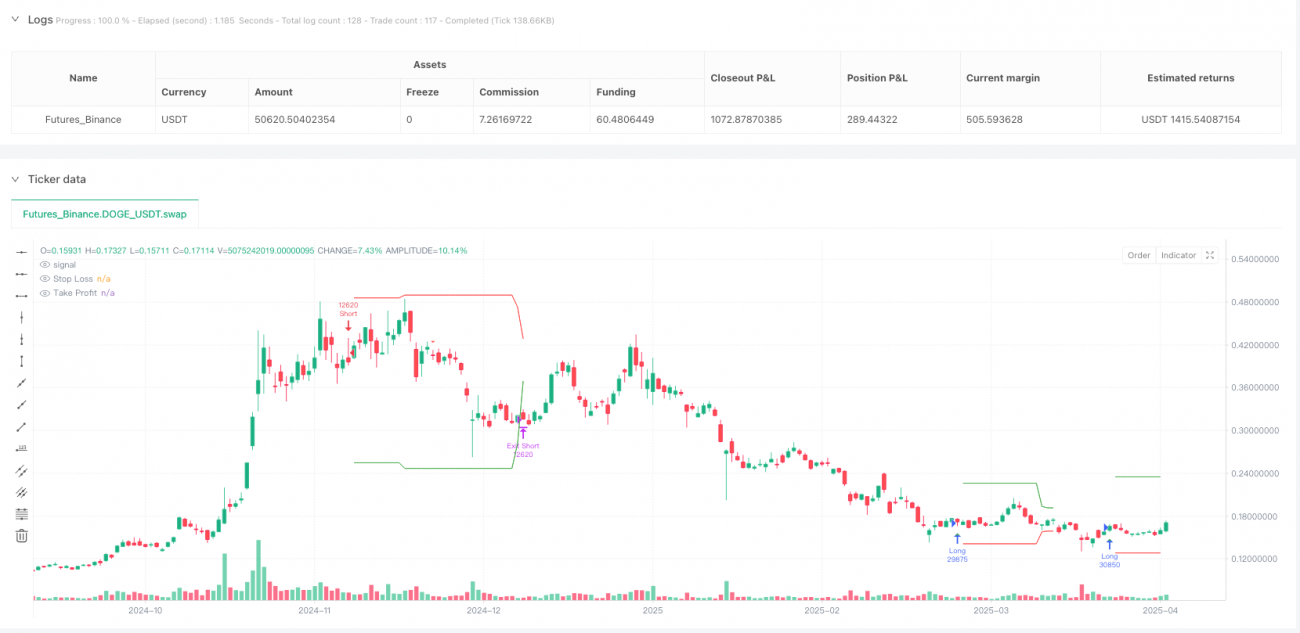
- 강세 다이버전스: 가격이 신저가를 기록했으나 RSI는 더 높은 저점을 형성합니다.
- 약세 다이버전스: 가격이 신고가를 기록했으나 RSI는 더 낮은 고점을 형성합니다.
- 거래 실행 시스템:
- 이중 모드 손절 메커니즘 사용: 최근 20기간(조정 가능) 스윙 포인트 또는 ATR 변동폭 기반.
- 동적 이익실현 계산: 위험 금액에 사전 설정된 보상-위험 비율(기본 2:1)을 곱하여 산출합니다.
- 시각화 시스템: 차트에 모든 유효한 다이버전스 신호를 표시하고, 현재 포지션의 손절(빨간색) 및 이익실현(초록색) 수평선을 실시간으로 표시합니다.
장점 분석
- 다차원 검증 메커니즘: 가격과 RSI가 동시에 특정 패턴을 충족해야 하며, 시간 간격이 사전 설정된 범위 내에 있어야 하므로 가짜 신호 확률이 크게 낮아집니다.
- 적응형 위험 관리:
- 스윙 포인트 모드는 추세 시장에 적합하며, 효과적으로 스윙 흐름을 포착합니다.
- ATR 모드는 변동성 시장에 적합하며, 변동성에 따라 손절 폭을 자동 조정합니다.
- 높은 구성 가능성: 모든 주요 매개변수(RSI 기간, 피봇 감지 범위, 위험-보상 비율 등)는 시장 특성에 따라 조정 가능합니다.
- 과학적 자금 관리: 기본적으로 10%의 포지션 비율을 사용하여 단일 거래의 과도한 위험 노출을 방지합니다.
- 실시간 시각적 피드백: 차트 표시와 동적 손절/이익실현 선을 통해 직관적인 거래 결정 지원을 제공합니다.
위험 분석
- 지연성 위험: RSI는 후행 지표이므로 급격한 단방향 시장에서 지연 신호가 발생할 수 있습니다. 완화 방안: 추세 필터 결합 또는 RSI 기간 단축.
- 변동성 시장 위험: 명확한 추세가 없을 때 연속적인 가짜 신호가 발생할 수 있습니다. 완화 방안: ATR 모드 활성화 및 승수 증가, 또는 변동성 필터 추가.
- 매개변수 과적합 위험: 특정 매개변수 조합은 과거 데이터에서 좋은 성과를 보일 수 있지만 실전에서는 무효화될 수 있습니다. 완화 방안: 다기간, 다품목 스트레스 테스트 수행.
- 극단적 시장 위험: 갭 발생 시 손절이 무효화될 수 있습니다. 완화 방안: 주요 경제 이벤트 전후 거래 회피 또는 옵션 헤지 사용.
- 시간 프레임 의존성: 다른 시간 주기에서 성과 차이가 클 수 있습니다. 완화 방안: 목표 시간 프레임에서 충분한 백테스트 최적화 수행.
최적화 방향
- 복합 지표 검증: MACD 또는 거래량 지표를 추가하여 2차 확인을 수행하고 신호 품질을 향상시킵니다.
- 동적 매개변수 조정: 시장 변동성에 따라 RSI 기간과 ATR 승수를 자동 조정합니다.
- 머신러닝 최적화: 유전자 알고리즘을 사용하여 주요 매개변수 조합을 최적화합니다.
- 다중 시간 프레임 분석: 더 큰 시간 프레임의 추세 방향 필터를 도입합니다.
- 포지션 동적 관리: 변동성에 따라 포지션 크기를 조정하여 위험 균형을 실현합니다.
- 이벤트 필터: 경제 캘린더 데이터를 통합하여 중요한 데이터 발표 전후의 거래를 피합니다.
요약
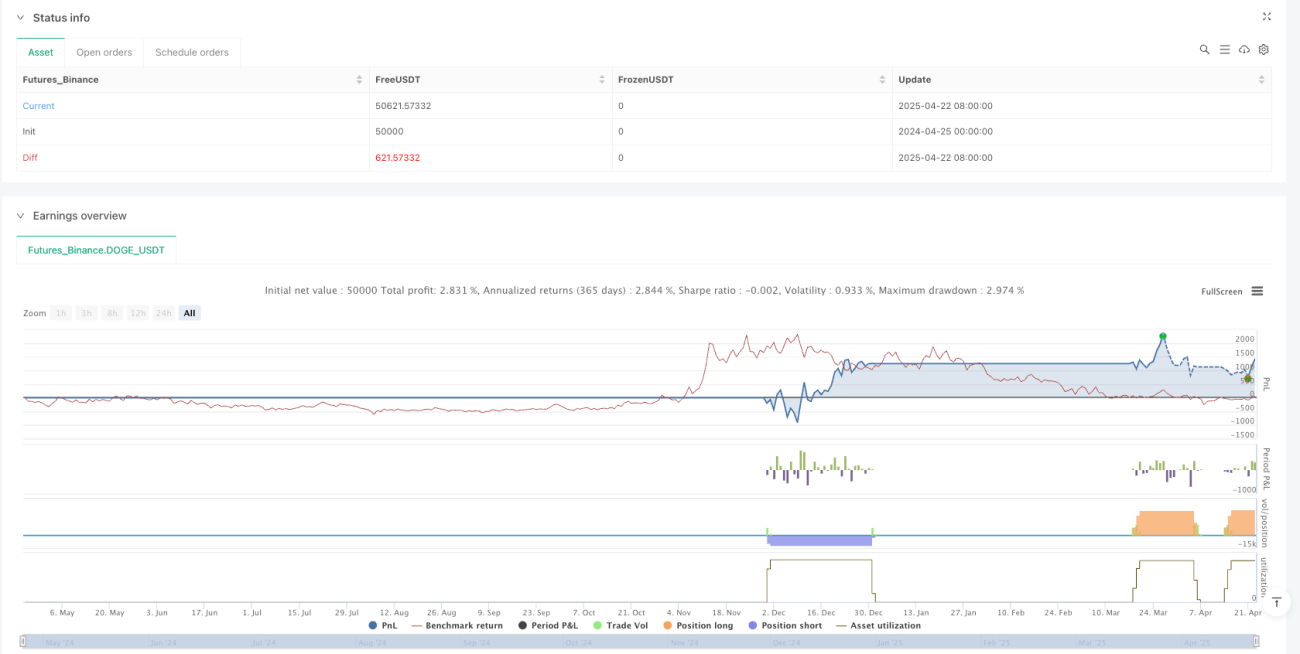
RSI 이중 피봇 다이버전스 퀀트 전략은 체계적인 다이버전스 식별과 엄격한 위험 관리를 통해 구조화된 반전 거래 방법을 제공합니다. 핵심 가치는 전통적인 기술 분석 개념을 계량화된 거래 규칙으로 전환하고, 이중 모드 손절 메커니즘을 통해 다양한 시장 환경에 적응하는 데 있습니다. 전략이 우수한 성과를 내기 위해서는 적절한 매개변수 최적화, 엄격한 위험 관리, 일관된 실행 규율의 세 가지 핵심 요소가 필요합니다. 이 전략은 일정한 변동성이 있지만 추세가 극단적이지 않은 시장 환경에 특히 적합하며, 중급 트레이더가 퀀트 트레이딩으로 전환하는 훌륭한 템플릿입니다.
Source
Pine
/*backtest
start: 2024-04-25 00:00:00
end: 2025-04-23 08:00:00
period: 1d
basePeriod: 1d
exchanges: [{"eid":"Futures_Binance","currency":"DOGE_USDT"}]
*/

//@version=6
strategy("RSI Divergence Strategy - AliferCrypto", overlay=true, default_qty_type=strategy.percent_of_equity, default_qty_value=10)

// === RSI Settings ===Strategy parameters
Comment
All comments (0)
No data
- 1