다중 필터 RSI 모멘텀 확인 트레이딩 전략

개요
다중 필터 RSI 모멘텀 확인 거래 전략은 암호화폐 시장을 위해 설계된 체계적인 트레이딩 방법입니다. 이 전략은 RSI 모멘텀 신호, 거래량 확인 및 정확한 캔들 패턴 인식을 결합하여 높은 확률의 진입 지점을 식별하는 동시에 약한 신호를 걸러냅니다. 거래를 시작하기 위해 여러 조건이 동시에 충족되어야 하는 다층 필터 시스템을 구현하며, RSI 모멘텀 전환, 유의미한 거래량 및 강력한 캔들 패턴을 요구함으로써 가장 신뢰할 수 있는 거래 설정만을 포착하는 것을 목표로 합니다.
이 전략의 핵심은 다중 확인 메커니즘의 강력한 조합에 있습니다. RSI는 잠재적인 모멘텀 전환을 식별하지만 변동장에서 허위 신호를 생성할 수 있으며, 거래량 확인은 충분한 시장 관심이 있을 때만 거래가 실행되도록 보장합니다. 캔들 패턴 요구 사항은 강력한 가격 움직임을 요구하여 약한 반전 신호를 걸러냅니다. 이 세 가지 필터가 결합되면 허위 신호가 크게 줄어들고 강력한 모멘텀 전환만 포착됩니다. 또한 이 전략은 ATR 변동성 또는 고정 비율 위험을 기반으로 한 자동 손절 및 이익 실현 위치 설정을 제공하는 내장된 리스크 관리 기능을 포함합니다.
전략 원리
이 전략의 핵심 로직은 세 가지 주요 기술 지표의 시너지 효과에 기반합니다. 첫째는 RSI 모멘텀 감지 메커니즘으로, 14주기 RSI 지표를 사용하여 70을 과매수 수준, 30을 과매도 수준으로 설정합니다. 롱 포지션 진입을 위해 RSI가 30 아래에서 30 위로 상향 돌파하는 것을 감지하는데, 이는 과매도 상태에서 강세 모멘텀으로의 전환을 나타냅니다. 숏 포지션 진입을 위해 RSI가 70 위에서 70 아래로 하향 돌파하는 것을 식별하여 과매수 상태에서 약세 모멘텀으로의 전환을 나타냅니다.
두 번째 핵심 구성 요소는 거래량 확인 시스템입니다. 현재 캔들의 거래량이 14주기 거래량 단순 이동 평균을 초과해야 합니다. 이는 충분한 시장 참여도가 있을 때만 거래가 실행되도록 보장하여 낮은 유동성 환경에서의 허위 돌파를 걸러냅니다. 세 번째 필터는 캔들 패턴 분석으로, 강력한 강세 또는 약세 캔들을 요구하며, 여기서 몸통 부분은 캔들 전체 범위의 최소 50%를 차지해야 합니다. 이는 가격 움직임이 결정적인 특성을 가지도록 하여 불확실한 시장 상황에서의 약한 신호를 방지합니다.
또한 선택적 슈퍼 트렌드 필터를 제공하며, 활성화되면 롱 포지션 진입은 슈퍼 트렌드 상승 방향과, 숏 포지션 진입은 하락 추세와 정렬되어야 합니다. 동적 ATR 손절 시스템은 현재 시장 변동성에 따라 보호 수준을 조정하며, 3.5배 ATR 승수를 사용하여 손절 및 이익 목표를 계산하거나 고정 0.5% 손절 옵션을 제공하며 위험 보상 비율은 1.5:1로 설정됩니다.
장점 분석
다중 필터 RSI 모멘텀 확인 거래 전략은 여러 뚜렷한 장점을 가지고 있습니다. 첫째는 강력한 신호 필터링 능력입니다. RSI 모멘텀 전환, 거래량 확인 및 강력한 캔들 패턴 세 가지 조건이 동시에 충족되어야 하므로 허위 신호 확률이 크게 낮아집니다. 이러한 다중 확인 메커니즘은 시장이 진정한 모멘텀 전환의 징후를 보일 때만 거래가 실행되도록 보장하여 거래 성공률을 높입니다.
둘째, 전략은 뛰어난 적응성과 유연성을 자랑합니다. 동적 ATR 손절 시스템은 시장 변동성에 따라 보호 수준을 자동으로 조정하여 높은 변동성 기간에는 더 넉넉한 손절을, 낮은 변동성 기간에는 타이트한 보호를 제공합니다. 이러한 적응형 특성 덕분에 다양한 시장 조건에서 효과를 유지할 수 있습니다. 선택적 슈퍼 트렌드 필터는 거래자에게 추가적인 추세 확인 도구를 제공하여 신호 품질을 더욱 향상시킵니다.
세 번째 중요한 장점은 포괄적인 리스크 관리 시스템입니다. 이 전략은 ATR 기반 동적 손절과 고정 비율 손절의 두 가지 청산 방식을 제공하며, 거래자는 자신의 위험 선호도에 따라 적절한 방법을 선택할 수 있습니다. 1.5:1의 위험 보상 비율 설정은 승률이 다소 낮더라도 수익성을 유지할 수 있도록 양호한 손익분기점을 보장합니다. 또한 전략은 롱 전용, 숏 전용 또는 양방향 거래 등 여러 거래 방향 구성을 지원합니다.
위험 분석
이 전략은 다중 필터 메커니즘을 가지고 있음에도 불구하고 주의해야 할 몇 가지 잠재적 위험이 있습니다. 가장 큰 위험은 강한 추세 시장에서 거래 기회를 놓칠 수 있다는 점입니다. RSI 과매수/과매도 신호에 의존하기 때문에 지속적으로 상승하거나 하락하는 강한 추세에서는 RSI가 오랜 기간 극단적인 수준에 머물러 진입 신호를 생성하지 못할 수 있으며, 이로 인해 중요한 추세 기회를 놓칠 수 있습니다. 해결 방법은 더 높은 시간 프레임의 추세 분석을 결합하거나 특정 시장 조건에 맞게 RSI 매개변수를 조정하는 것입니다.
두 번째 중요한 위험은 변동장에서의 잦은 거래입니다. 다중 필터가 허위 신호를 줄이지만 횡보 국면에서는 여전히 유효해 보이지만 결국 실패하는 여러 돌파 신호가 발생할 수 있습니다. 이는 연속적인 소폭 손실의 누적으로 이어질 수 있습니다. 완화 전략에는 변동성 지표나 추세 강도 지표와 같은 추가 시장 상태 필터를 포함하여 낮은 추세 환경에서는 거래를 중단하는 것이 포함됩니다.
세 번째 위험은 매개변수 최적화 과적합과 관련됩니다. 전략에는 RSI 기간, ATR 기간, 위험 보상 비율 등 여러 조정 가능한 매개변수가 포함되어 있으며, 이러한 매개변수를 과거 데이터에 과도하게 최적화하면 미래 성과가 저조할 수 있습니다. 강건한 매개변수 설정을 사용하고 정기적으로 샘플 외 테스트를 수행하며 제한된 과거 데이터에 기반한 과도한 최적화를 피하는 것이 좋습니다. 또한 거래 비용과 슬리피지는 고빈도 거래 환경에서 전략 성과에 상당한 영향을 미칠 수 있으며, 특히 작은 시간 프레임에서 거래할 때 더욱 그렇습니다.
최적화 방향
이 전략은 여러 중요한 최적화 방향을 가지고 있습니다. 첫째는 시장 상태 인식 능력 강화로, 평균 실제 범위 비율, 변동성 지수 또는 추세 강도 지표와 같은 추가 시장 분류 지표를 통합하여 다양한 시장 환경을 더 잘 식별할 수 있습니다. 높은 변동성 환경에서는 RSI 임계값을 조정하거나 추가 확인 조건을 추가할 수 있고, 낮은 변동성 환경에서는 신호 민감도를 높이기 위해 매개변수를 강화할 수 있습니다. 이러한 적응형 매개변수 조정은 다양한 시장 조건에서 전략 성과를 크게 향상시킬 것입니다.
두 번째 최적화 방향은 다중 시간 프레임 분석 구현입니다. 현재 전략은 주로 단일 시간 프레임에서 작동하며, 더 높은 시간 프레임의 추세 확인을 통합하면 신호 품질을 크게 향상시킬 수 있습니다. 예를 들어, 5분 차트에서 전략을 실행할 때 15분 또는 1시간 차트의 추세 방향 정렬을 요구할 수 있습니다. 이 방법은 역추세 거래 빈도를 줄이고 전체 승률을 높일 것입니다.
세 번째 핵심 최적화는 동적 포지션 관리 시스템의 구현입니다. 현재 전략은 고정 위험 보상 비율을 사용하지만 시장 변동성, 신호 강도 또는 과거 성과에 따라 포지션 크기와 목표를 동적으로 조정할 수 있습니다. 확실성이 높은 신호에서는 포지션을 늘리고 불확실성이 높을 때는 줄이는 이러한 동적 조정은 자본 효율성을 극대화할 것입니다.
네 번째 최적화 방향은 머신러닝 구성 요소 통합입니다. 과거 데이터를 사용하여 최적의 진입 조건 조합을 식별하거나 신호 성공 확률을 예측하는 모델을 훈련할 수 있습니다. 이 방법은 정적 설정에 의존하는 대신 현재 시장 조건에 따라 전략 매개변수를 동적으로 조정할 수 있습니다.
요약
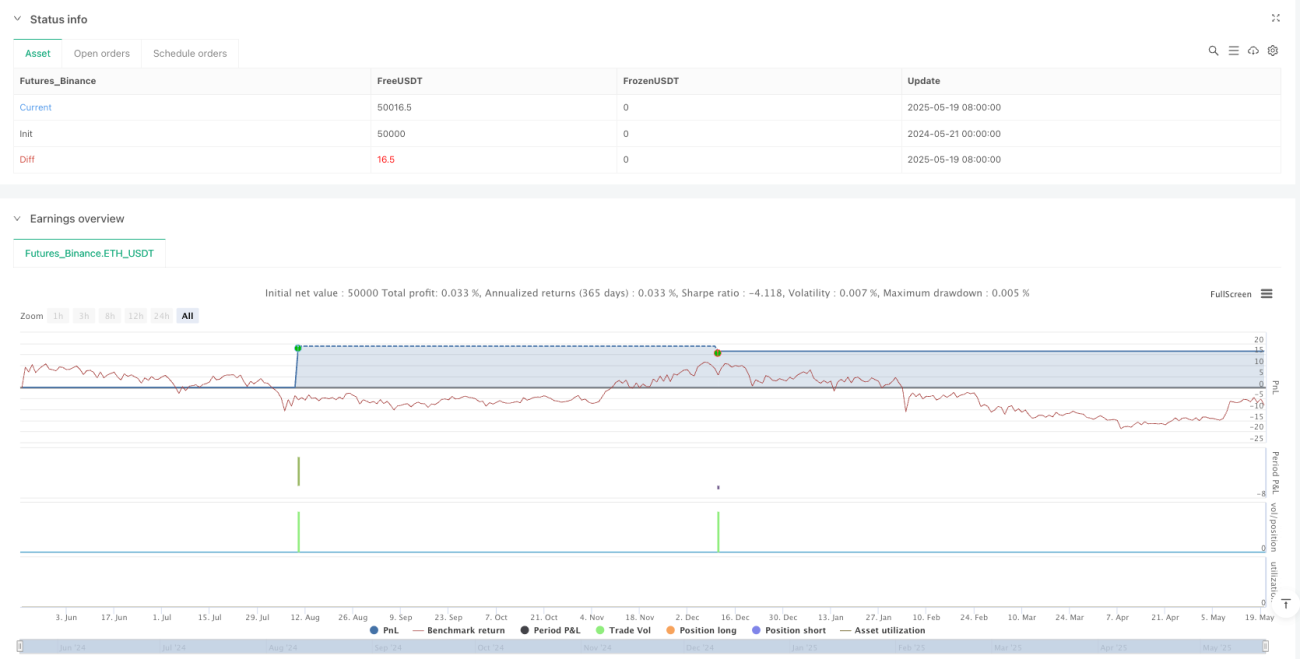
다중 필터 RSI 모멘텀 확인 거래 전략은 기술 지표, 거래량 분석 및 리스크 관리를 능숙하게 결합하여 강력한 거래 시스템을 만든 정교한 퀀트 트레이딩 방법을 대표합니다. 이 전략의 핵심 장점은 다층 필터 메커니즘으로, 허위 신호를 효과적으로 줄이면서 실제 시장 기회에 대한 민감성을 유지합니다. 동적 ATR 손절 시스템과 유연한 매개변수 구성 덕분에 다양한 시장 환경 및 거래 선호도에 적응할 수 있습니다.
BTCUSDT 5분 차트에서의 백테스트 결과는 양호한 성과를 보여주었으며, 58.49% 승률, 1.472의 이익 팩터, 3.01%에 불과한 최대 하락률은 위험 조정 수익률의 효과성을 입증했습니다. 그러나 거래자는 특히 빠르게 변화하는 암호화폐 시장에서 모든 전략에 내재된 위험이 있음을 인식해야 합니다.
이 전략을 성공적으로 구현하려면 지속적인 모니터링, 정기적인 매개변수 평가 및 시장 조건 변화에 대한 적응적 조정이 필요합니다. 제안된 최적화 방향, 특히 다중 시간 프레임 분석 및 동적 매개변수 조정을 통해 이 전략은 성과를 더욱 향상시킬 큰 잠재력을 가지고 있습니다. 궁극적으로 이 전략은 암호화폐 거래에 체계적인 접근 방식을 원하는 거래자에게 견고한 기반을 제공하지만 항상 적절한 리스크 관리 및 지속적인 학습과 결합되어야 합니다.
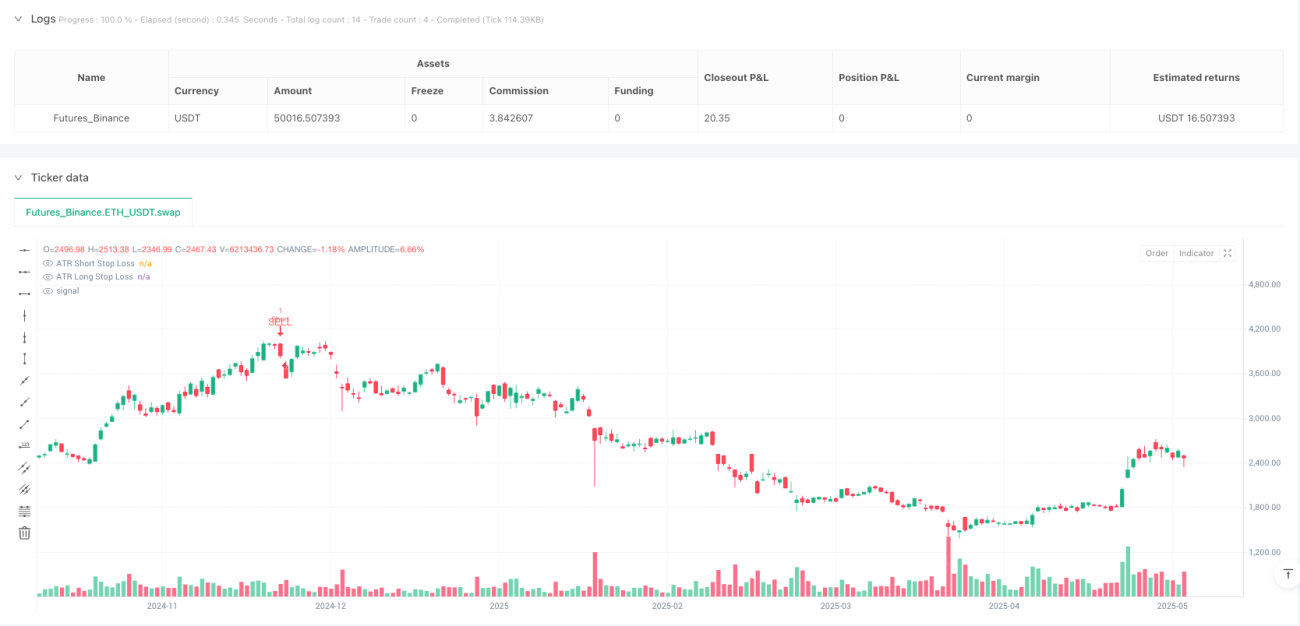
/*backtest
start: 2024-05-21 00:00:00
end: 2025-05-20 08:00:00
period: 1d
basePeriod: 1d
exchanges: [{"eid":"Futures_Binance","currency":"ETH_USDT"}]
*/

// This Pine Script™ code is subject to the terms of the Mozilla Public License 2.0 at https://mozilla.org/MPL/2.0/
// © nioboi

// Best settings already at default. - 1