개요
이 전략은 Z 점수 (Z-Score) 에 기반한 통계학적 개념으로, 가격의 지역 평균에 대한 통계적 편차를 식별하기 위해 사용된다. 이 전략은 종전 가격의 Z 점수를 계산하고, 그 다음 단기 및 장기 이동 평균을 적용하여 Z 점수를 평형화한다.
전략 원칙
이 전략의 핵심은 Z 점수의 계산과 적용이다. Z 점수는 표준 차이의 단위로 데이터 포인트의 표본 평균과 오차를 측정하는 통계에 사용된다. 이 전략에서 Z 점수를 계산하는 공식은 다음과 같다. Z = (폐쇄 가격 - SMA (폐쇄 가격, N)) / STDEV (폐쇄 가격, N) 여기서 N은 사용자 정의의 기본 주기이다.
정책의 실행 과정은 다음과 같습니다:
- 종전 가격의 원시 Z 점수를 계산합니다.
- 원시 Z 등급에 적용된 단기 평준화 (SMA)
- 원시 Z 등급에 적용된 장기 평준화 (SMA)
- 단기 평평 Z 등급에 장기 평평 Z 등급을 입었을 때, 추가 조건이 충족되면 더 많은 것을 입는
- 단기 평평 Z 등급 아래에서 장기 평평 Z 등급을 입었을 때, 추가 조건이 충족되면 평평합니다.
추가 조건은 다음과 같습니다.
- 신호 간격: 동일한 유형의 두 개의 신호 (입기 또는 출력) 사이에는 최소 수의 K선 간격이 있어야 한다.
- 동력 필터링: 연속적으로 3개 이상의 상승K선이 나타나면 출전 금지; 연속적으로 3개 이상의 하락K선이 나타나면 출전 금지
전략적 이점
- 기본 통계Z 점수는 가격의 평균에서 벗어난 정도를 효과적으로 식별할 수 있는 정교한 통계 도구로, 가격의 평균으로 돌아가는 기회를 잡을 수 있습니다.
- 부드러운 처리: 원시 Z 점수를 적용하여 단기 및 장기 평준화를 함으로써 소음을 줄이고 신호 품질을 향상시킨다.
- 신호 간격 제어: 최소 신호 간격을 설정하여 과도한 거래와 반복 신호를 효과적으로 줄입니다.
- 동력 필터강세를 보이는 상황에서 역전 거래를 금지함으로써 강세를 보이는 상황에서 불필요한 손실을 방지한다.
- 간결함전략: 종식 가격 데이터를 사용하며, 복잡한 지표 조합에 의존하지 않으며, 이해하기 쉽고 실행할 수 있습니다.
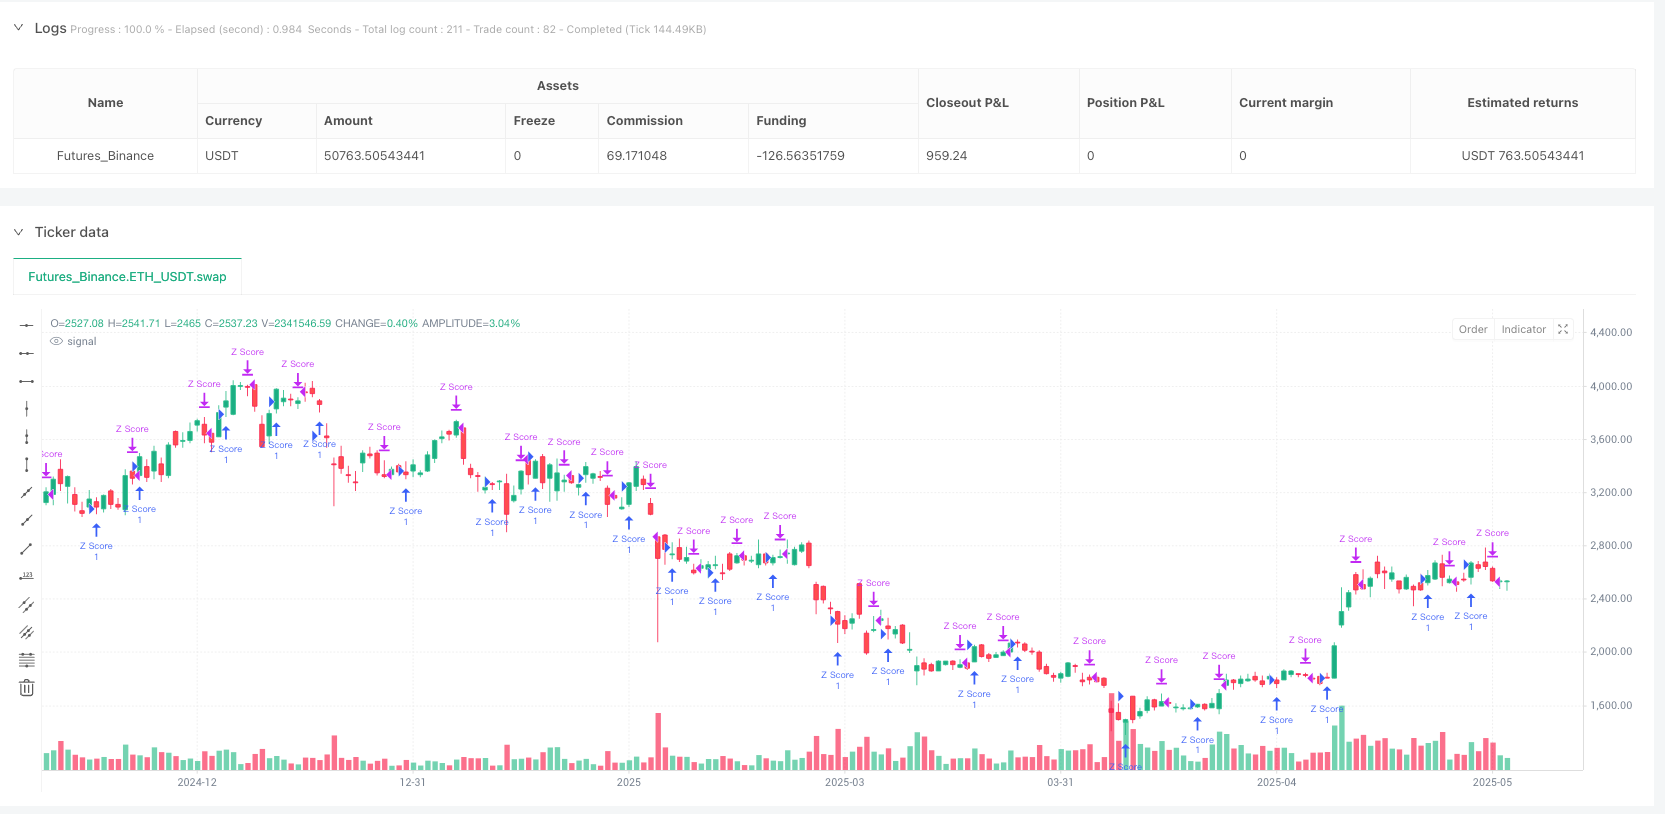
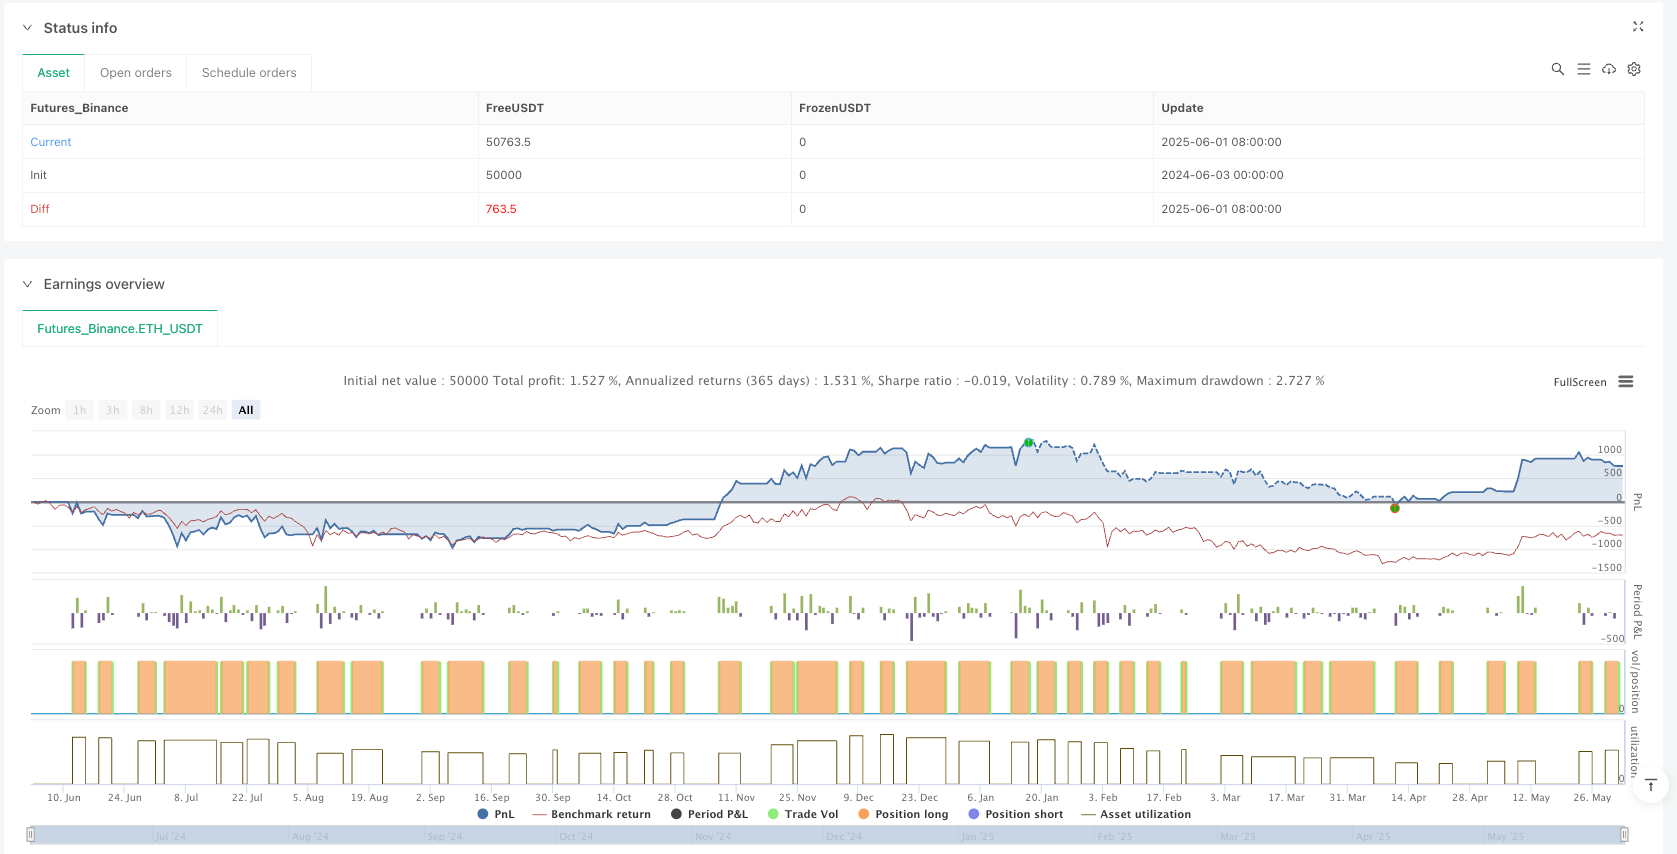
- 실시간 수익감시: 거래자가 보유 상태를 모니터링 할 수 있도록 실시간으로 손실을 표시하는 표를 포함합니다.
- 변수 유연성: 사용자는 다양한 시장과 시간 프레임에 따라 Z 등급 기본 주기 및 유연한 매개 변수를 조정하여 적응력을 높일 수 있습니다.
전략적 위험
- 통계적 가정의 위험Z 등급: Z 등급은 가격 분포가 거의 정형 분포라고 가정하며, 정형 분포가 아닌 시장 환경에서 좋지 않은 성과를 낼 수 있다.
- 매개변수 민감도: Z 점수 기본 주기 및 미끄러운 파라미터의 선택은 전략 성능에 중요한 영향을 미치며, 파라미터 선택이 잘못되면 과조합 또는 신호 지연이 발생할 수 있다.
- 단일 인자 제한: 전략은 Z 점수를 기반으로만 신호를 교차 생성하고, 다른 확인 지표가 없으면, 가짜 신호를 유발할 수 있다.
- 시장환경의존성: 강한 추세 시장에서, 평균값 회귀에 기반한 전략은 계속해서 잘못된 신호를 줄 수 있다.
- 신호 지연: 이동 평균의 부드러운 사용으로 인해 신호가 지연되어 최적의 진입 또는 출구 지점을 놓칠 수 있다.
해결책:
- 다양한 시장 환경에 대한 재검토를 통해 최적의 요소 조합을 찾아내는 것
- 트렌드 필터와 결합하여 강세를 보이는 시장에서 거래를 줄이거나 차단합니다.
- 거래량 분석이나 다른 기술 지표와 같은 추가 확인 지표를 추가합니다.
- 시장의 변동성에 따라 자동으로 Z 점수 변수를 조정하는 적응 변수를 사용하는 것을 고려하십시오
최적화 방향
- 트렌드 인식 통합: 트렌드 인식 컴포넌트를 추가하여 명확한 트렌드 방향의 시장에서 전략적 행동을 조정한다. 이것은 장기 이동 평균 또는 ADX 지표로 수행 할 수 있으며, 강한 트렌드에서 잘못된 평균 회귀 신호를 피한다.
- 변동성 조정: Z 점수 매개 변수의 적응 조정, 시장의 변동성에 따라 기본 주기를 자동으로 최적화하고 매개 변수를 미끄러집니다. 이것은 다양한 시장 환경에서 전략의 강도를 향상시킵니다.
- 다중 시간 프레임 분석: 더 높은 시간 프레임의 Z 점수 신호를 통합하여 확인으로, 여러 시간 프레임의 신호가 일치할 때만 거래하고, 가짜 신호를 줄인다.
- 손해 방지 장치: Z 등급의 변동 범위에 기반한 동적 스톱로드를 구현하여 위험 관리 능력을 향상시킨다. 예를 들어, 스톱로드를 입수 Z 등급의 특정 오차 배수로 설정할 수 있다.
- 이윤의 일부: 분기 수익 전략을 구현하고, Z 등급이 특정 하락에 도달했을 때 부분적으로 청산하고, 자금 관리를 최적화한다.
- 양수 확인: 거래량 분석을 트랜잭션 확인으로 추가하고, Z 등급 신호가 거래량으로 뒷받침되는 경우에만 트랜잭션을 실행하고, 신호 품질을 향상한다.
- 포트폴리오: Z 점수를 다른 통계 또는 기술 지표와 결합하여 RSI 또는 브린 띠와 같은 다중 요소 의사 결정 모델을 만들고 전략 신뢰성을 강화합니다.
요약하다
평평한 Z 점수 교차에 기반한 동적 최적화 가격 통계 거래 전략은 통계학 원칙에 기반한 간결한 거래 시스템으로, 가격의 지역 평균에 대한 편차와 회귀를 포착하는 데 중점을 두고 있다. 평평한 처리를 통해, 신호 간격 제어 및 동적 필터링을 통해, 이 전략은 노이즈 거래를 효과적으로 줄이고, 신호 품질을 향상시킨다. 이 전략은 특히 불안한 시장과 평균 회귀 행동이 명백한 금융 상품에 적합하다.
그러나 전략에는 통계적 가정, 변수 민감성 및 단일 요소 의사 결정에 의존하는 것과 같은 몇 가지 제한이 있습니다. 트렌드 식별, 변동성 조정, 다중 시간 프레임 분석, 스톱 로즈 메커니즘, 거래량 확인 및 다중 요소 조합과 같은 최적화 조치를 추가함으로써 전략의 거친성과 성능을 크게 향상시킬 수 있습니다.
종합적으로, 이것은 이론적 기반이 단단하고, 간결하고, 이해하기 쉽고, 확장 가능한 전략적 프레임워크를 구현하며, 거래 시스템의 기본 구성 요소 또는 트레이더가 거래에서 통계학의 응용을 이해하는 데 도움이되는 교육 도구로 적합합니다.
/*backtest
start: 2024-06-03 00:00:00
end: 2025-06-02 00:00:00
period: 1d
basePeriod: 1d
exchanges: [{"eid":"Futures_Binance","currency":"ETH_USDT"}]
*/

//@version=6
strategy("Price Statistical Strategy-Z Score V 1.01", overlay=true)

// === Enable / Disable Z-Score Strategy Block ===
enableZScore = input.bool(true, title="Enable Smoothed Z-Score Strategy", tooltip="When enabled, this block calculates a smoothed Z-Score of the closing price and generates entry/exit signals based on crossover behavior between short-term and long-term smoothed Z-Scores.\n\nRecommended for quick and classic detection of price deviation from mean.\nSensitive to outliers. Best suited for relatively normal-distributed market conditions.")

// === Z-Score Parameters ===
zBaseLength = input.int(3, minval=1, title="Z-Score Base Period")
shortSmooth = input.int(3, title="Short-Term Smoothing")
longSmooth = input.int(5, title="Long-Term Smoothing")

// === Z-Score Calculation Function ===
f_zscore(src, length) =>
    mean = ta.sma(src, length)
    std_dev = ta.stdev(src, length)
    z = (src - mean) / std_dev
    z

// === Z-Score Logic ===
zRaw = f_zscore(close, zBaseLength)
zShort = ta.sma(zRaw, shortSmooth)
zLong = ta.sma(zRaw, longSmooth)


// === Minimum gap between identical signals ===
gapBars = input.int(5, minval=1, title="Bars gap between identical signals", tooltip="Minimum number of bars required between two identical signals (entry or exit). Helps reduce signal noise.")


// === Candle-based momentum filters ===
bullish_3bars = close > close[1] and close[1] > close[2] and close[2] > close[3] and close[3] > close[4]
bearish_3bars = close < close[1] and close[1] < close[2] and close[2] < close[3] and close[3] < close[4]

// === Entry and Exit Logic with minimum signal gap and candle momentum filter ===
var int lastEntryBar = na
var int lastExitBar  = na

if enableZScore
    longCondition = (zShort > zLong)
    exitCondition = (zShort < zLong)

    if longCondition and (na(lastEntryBar) or bar_index - lastEntryBar > gapBars) and not bullish_3bars
        strategy.entry("Z Score", strategy.long)
        lastEntryBar := bar_index

    if exitCondition and (na(lastExitBar) or bar_index - lastExitBar > gapBars) and not bearish_3bars
        strategy.close("Z Score", comment="Z Score")
        lastExitBar := bar_index

// === Real-time PnL Table for Last Open Position ===
var table positionTable = table.new(position.bottom_right, 2, 2, border_width=1)

// Header Labels
table.cell(positionTable, 0, 0, "Entry Price", text_color=color.white, bgcolor=color.gray)
table.cell(positionTable, 1, 0, "Unrealized PnL (%)", text_color=color.white, bgcolor=color.gray)

// Values (only when position is open)
isLong        = strategy.position_size > 0
entryPrice    = strategy.position_avg_price
unrealizedPnL = isLong ? (close - entryPrice) / entryPrice * 100 : na

// Define dynamic text color for PnL
pnlColor = unrealizedPnL > 0 ? color.green : unrealizedPnL < 0 ? color.red : color.gray

// Update Table Content
if isLong
    table.cell(positionTable, 0, 1, str.tostring(entryPrice, "#.####"), text_color=color.gray, bgcolor=color.new(color.gray, 90))
    table.cell(positionTable, 1, 1, str.tostring(unrealizedPnL, "#.##") + " %", text_color=pnlColor, bgcolor=color.new(pnlColor, 90))
else
    table.cell(positionTable, 0, 1, "—", text_color=color.gray, bgcolor=color.new(color.gray, 90))
    table.cell(positionTable, 1, 1, "—", text_color=color.gray, bgcolor=color.new(color.gray, 90))