
개요
변동성 최적화 RSI 평균 회귀 트레이딩 전략은 RSI(상대강도지수) 평균 회귀 신호, 스마트 시장 필터링 및 변동성 적응형 리스크 관리를 결합한 퀀트 트레이딩 전략입니다. 이 전략은 주로 RSI가 극단적 수준에 도달할 때 높은 확률의 반전 기회(RSI≤30은 과매도, RSI≥70은 과매수)를 식별하지만, 시장 상황이 평균 회귀 전략에 유리할 때만 거래를 실행합니다. 코드를 심층 분석해보면 이 전략의 핵심은 기술적 지표와 시장 상태 분석을 결합하여 트레이딩 결정을 최적화하고 다양한 시장 조건에서의 성과를 극대화하는 데 있습니다.
전략 원리
변동성 최적화 RSI 평균 회귀 트레이딩 전략의 원리는 다음과 같은 핵심 구성 요소에 기반합니다.
-
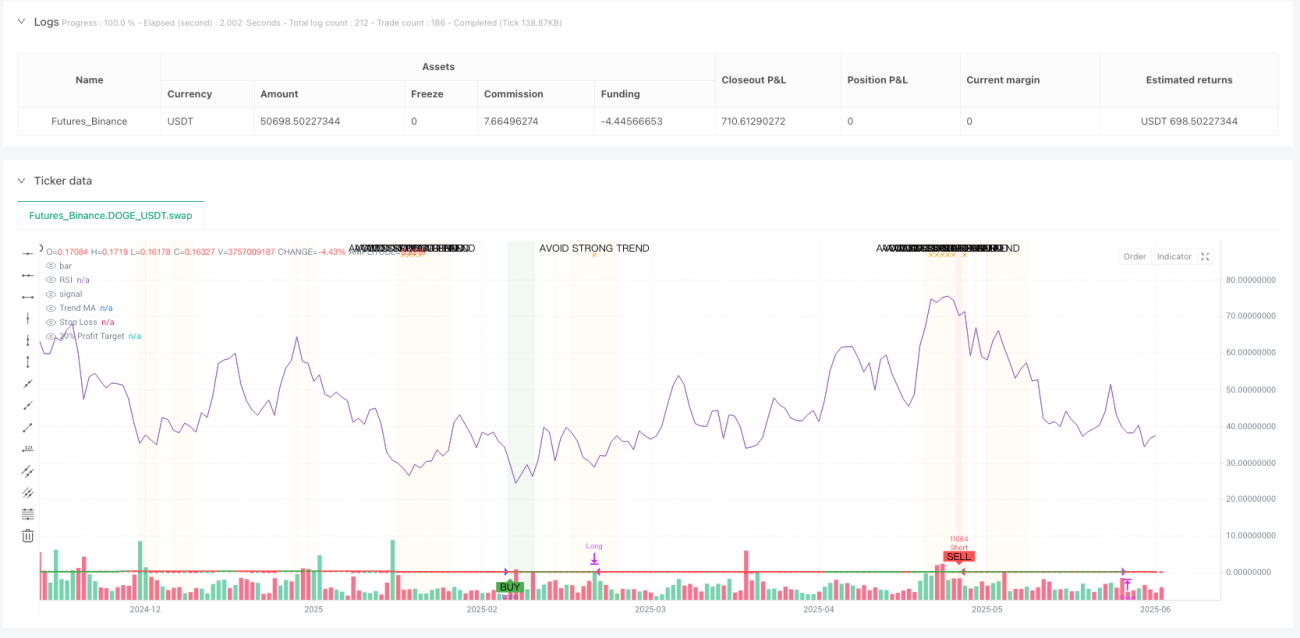
RSI 신호 시스템: 14주기 RSI 지표를 사용하여 시장의 과매수 및 과매도 상태를 식별합니다. RSI가 30 미만이면 시장이 과매도 상태로 간주되어 매수 신호가 발생하고, RSI가 70을 초과하면 과매수 상태로 간주되어 매도 신호가 발생합니다.
-
추세 분석: 전략은 50주기 단순이동평균(SMA)을 사용하여 시장 방향을 결정합니다. 가격이 이동평균 위에 있으면 상승 추세, 아래에 있으면 하락 추세를 나타냅니다. 더 중요한 것은 전략이 추세 강도를 계산하여 강한 추세 시장(추세 강도 >25%)에서는 거래를 피한다는 점입니다. 이러한 조건에서는 평균 회귀 전략이 일반적으로 좋지 않은 성과를 보이기 때문입니다.
-
시장 적응성 분석: 코드는 최근 변동성을 계산하여 시장 변동성이 충분히 커서(일일 변동성 >1%) 평균 회귀 전략을 지원하는지 확인합니다. 또한 추세 강도가 허용 가능한 범위(≤25%) 내에 있는지 확인합니다. 이러한 기준을 모두 충족하는 시장 조건에서만 전략이 진입을 고려합니다.
-
리스크 관리: 전략은 20% 손절매를 적용하여 변동성이 큰 자산에 충분한 가격 변동 폭을 제공하며, 동시에 20% 수익 목표를 설정하여 1:1의 위험/보상 비율을 보장합니다. 각 거래에 5%의 자금을 사용하며, 최대 두 개의 포지션을 피라미딩 방식으로 추가하여 강력한 설정에서 포지션을 확대할 수 있습니다.
-
신호 확인 및 청산: 진입 신호는 RSI가 극값에 도달하고 시장 조건이 적합해야 합니다. 청산 조건에는 RSI 반전(반대 극값 도달), 손절매 발동 또는 수익 목표 달성이 포함됩니다.
전략 장점
코드를 심층 분석한 결과, 이 전략은 다음과 같은 뚜렷한 장점을 보여줍니다.
-
시장 환경 적응성: 기본 RSI 전략과 달리 이 전략은 시장 상태 분석을 통해 거래 신호를 필터링하여 평균 회귀 전략에 적합하지 않은 시장 환경에서의 거래를 피함으로써 신호 품질을 크게 향상시킵니다.
-
변동성 적응형 리스크 관리: 20% 손절매 수준을 설정하여 변동성이 큰 자산에 맞게 설계되었으며, 정상적인 시장 변동으로 인한 조기 청산을 방지하면서도 충분한 보호 조치를 제공합니다.
-
정확한 진입 조건: RSI 극값, 추세 분석 및 변동성 확인을 결합하여 높은 확률의 설정에서만 진입하도록 보장하여 허위 신호를 줄입니다.
-
시각적 의사 결정 지원: 전략은 배경색 변경(녹색 배경은 매수 적합 영역, 빨간색 배경은 매도 적합 영역) 및 경고 레이블(주황색 경고는 강한 추세 감지, 거래 회피 필요)을 제공하여 트레이딩 결정의 직관성을 높입니다.
-
자동화 친화적: 완전한 알람 조건 시스템이 내장되어 있어 수동 모니터링 없이 자동 거래 실행을 지원합니다.
-
동적 정보 테이블: 현재 RSI 값, 추세 강도, 변동성 및 시장 적응성 평가를 포함한 시장 상황 및 거래 상태를 실시간으로 표시하여 트레이더에게 포괄적인 시장 관점을 제공합니다.
전략 리스크
전략이 합리적으로 설계되었음에도 불구하고 몇 가지 잠재적 리스크가 존재합니다.
-
매개변수 민감도: 전략 성과는 RSI 기간, 과매수/과매도 수준, 최대 추세 강도 및 변동성 임계값과 같은 입력 매개변수에 크게 의존합니다. 다양한 시장 환경은 서로 다른 매개변수 최적화를 필요로 할 수 있으며, 잘못된 매개변수는 전략 성과 저하로 이어질 수 있습니다.
-
극단적 시장 조건: 시장 붕괴나 극심한 변동성 기간 동안 20% 손절매를 설정했더라도 슬리피지 리스크가 발생하여 실제 손실이 예상보다 커질 수 있습니다.
-
자금 배분 리스크: 기본적으로 각 거래에 자금의 5%를 사용하고 최대 두 개의 포지션(총 10%)을 허용하므로, 특히 시장 변동성이 클 때 일부 트레이더에게는 너무 공격적일 수 있습니다.
-
추세 판단의 시차: 50주기 이동평균을 사용한 추세 판단은 지연성을 초래하여 추세가 막 전환될 때 잘못된 판단을 내릴 수 있습니다.
-
과도한 필터링 리스크: 엄격한 시장 적응성 검사(약한 추세 + 충분한 변동성)는 거래 기회를 과도하게 필터링하여 일부 시장 환경에서 거래 빈도가 너무 낮아질 수 있습니다.
해결 방법으로는 다양한 시장 및 시간 프레임에 대한 매개변수 최적화, 극단적 시장 조건에서 자동 거래 일시 중지, 개인 리스크 허용 범위에 따른 자금 배분 비율 조정, 추세 판단 지연성을 줄이기 위한 더 짧은 주기 이동평균 사용 고려, 거래 빈도 증가를 위한 시장 적응성 기준 완화 등이 있습니다.
전략 최적화 방향
코드 분석에 기반하여 이 전략은 다음과 같은 방향으로 최적화될 수 있습니다.
-
동적 매개변수 조정: RSI의 과매수/과매도 임계값을 동적 변수로 설계하여 과거 변동성에 따라 자동 조정합니다. 낮은 변동성 환경에서는 더 좁은 임계값 범위(예: 35/65)를, 높은 변동성 환경에서는 더 넓은 임계값 범위(예: 25/75)를 사용합니다. 이렇게 하면 전략이 다양한 시장 상태에 더 잘 적응할 수 있습니다.
-
다중 시간 프레임 분석: 다중 시간 프레임 확인 메커니즘을 추가합니다. 예를 들어 더 긴 시간 프레임에서 시장 상태를 확인하고 더 짧은 시간 프레임에서 진입 신호를 찾습니다. 이 방법은 신호 품질을 높이고 허위 돌파를 줄일 수 있습니다.
-
동적 손절매 전략: 고정 비율 대신 ATR(평균 실제 범위)을 기반으로 손절매 수준을 설정합니다. 이렇게 하면 손절매 지점이 현재 시장 변동성 상황에 더 잘 적응하여 높은 변동성 기간에는 너무 가깝게, 낮은 변동성 기간에는 너무 멀게 설정되는 것을 방지합니다.
-
부분 이익 실현 메커니즘: 전체 포지션을 20% 수익 목표에서 청산하는 대신 단계적 이익 실현 전략을 구현합니다. 예를 들어 10% 수익에서 포지션의 50%를 청산하고 20% 수익에서 나머지 포지션을 청산합니다. 이렇게 하면 일부 이익을 확보하면서 나머지 포지션은 더 큰 수익을 얻을 가능성을 남겨둡니다.
-
계절성 및 시장 주기 분석: 시장 계절성 및 주기 분석을 통합하여 역사적으로 평균 회귀 전략이 더 잘 수행된 기간에는 거래 빈도를 높이고 추세가 강한 기간에는 거래 빈도를 낮추거나 매개변수를 조정합니다.
-
머신러닝 최적화: 머신러닝 기술을 사용하여 현재 시장 환경에서 평균 회귀 전략의 성공 확률을 동적으로 예측하고 이에 따라 진입 기준과 포지션 크기를 조정합니다. 이렇게 하면 전략이 시장 변화에 더 지능적으로 적응할 수 있습니다.
요약
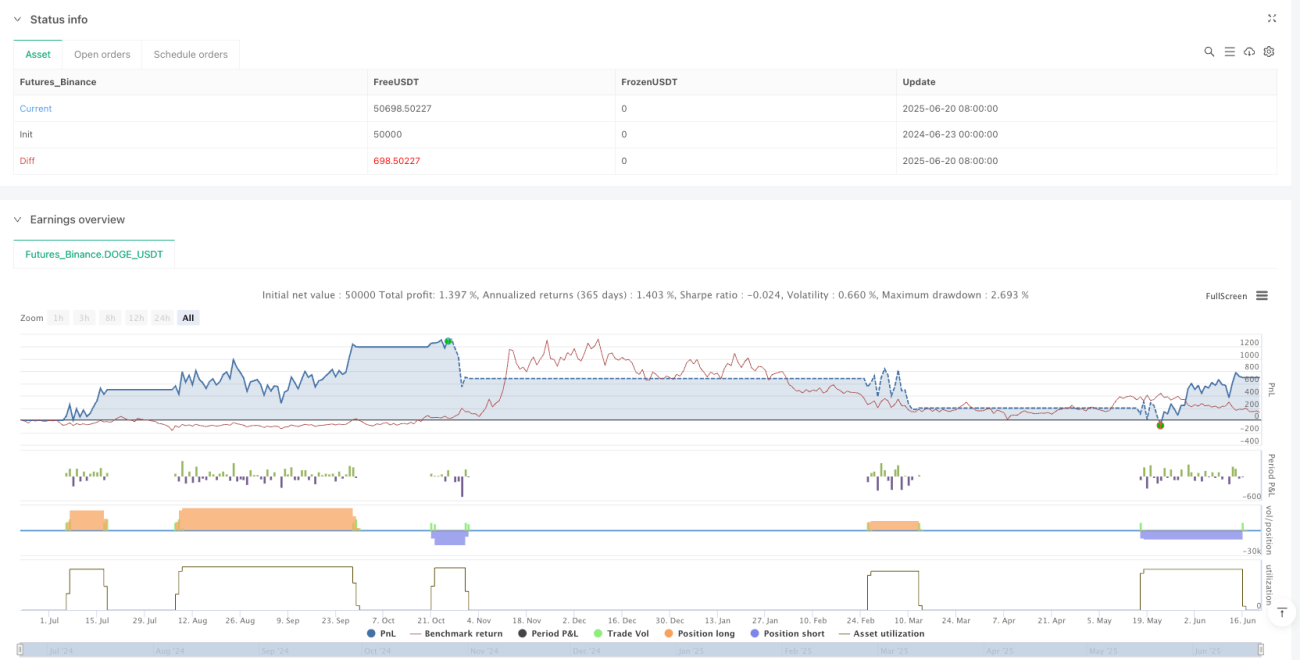
변동성 최적화 RSI 평균 회귀 트레이딩 전략은 포괄적이고 지능적인 거래 시스템으로, 기본 RSI 전략의 주요 단점을 해결하고 시장 컨텍스트 분석과 변동성 적응형 리스크 관리를 추가하여 전략 성과를 크게 향상시켰습니다. 이 전략은 특히 일일 변동성이 1% 이상인 자산, 특히 레인지 장세나 약한 추세 시장에 적합합니다.
전략의 핵심 장점은 스마트 시장 필터링 메커니즘으로, 시장 조건이 평균 회귀 거래에 적합할 때만 신호를 생성하고 적절한 리스크 관리 조치를 통해 자금을 보호합니다. 또한 완전한 시각화 시스템과 정보 테이블은 명확한 시장 상태 개요를 제공하여 더 현명한 거래 결정을 지원합니다.
일부 리스크와 최적화 여지가 있지만, 이 전략의 기본 설계는 견고하며 제안된 최적화 방향을 통해 다양한 시장 환경에서의 적응성과 성능을 더욱 향상시킬 수 있습니다. 변동성 시장에서 평균 회귀 기회를 포착하려는 트레이더에게 가치 있는 전략 프레임워크입니다.
- 1