
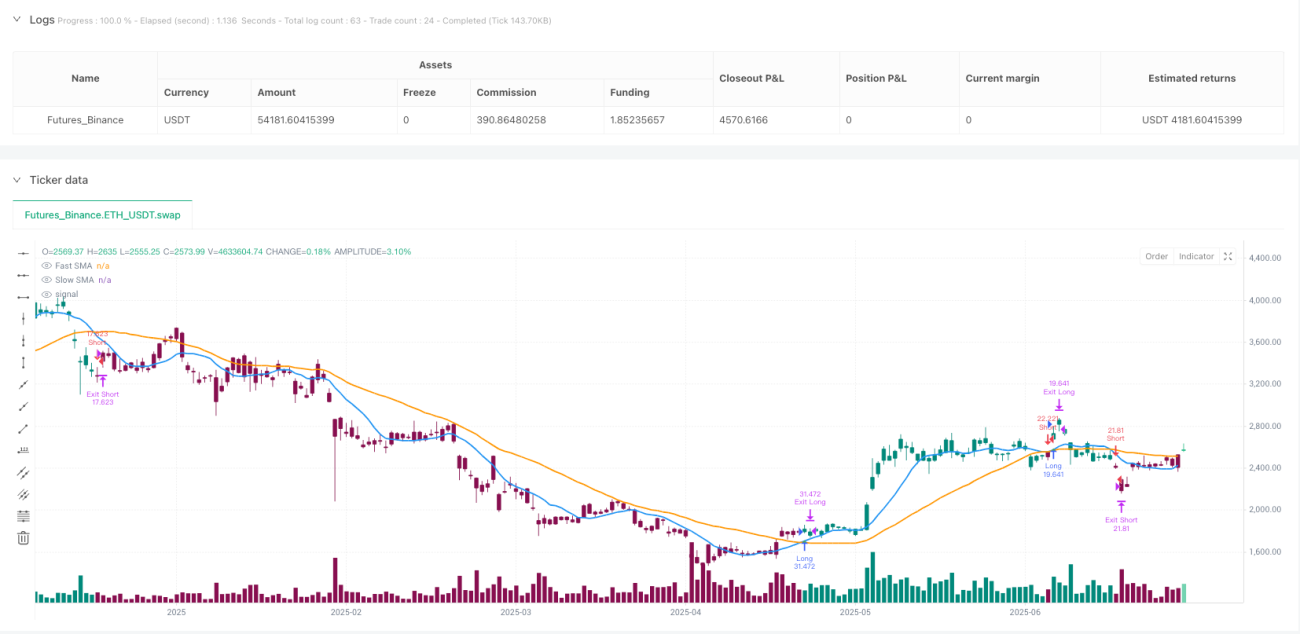
전략 개요
이 전략은 간단한 이동 평균 ((SMA) 의 교차를 기반으로 한 정량 거래 전략으로, 빠른 이동 평균과 느린 이동 평균 사이의 교차를 통해 시장 추세의 전환점을 식별하고, 고정된 비율의 중지 손실 메커니즘과 결합하여 위험과 수익을 관리합니다. 전략의 핵심 논리는 간단하고 직관적입니다. 빠른 이동 평균이 느린 이동 평균을 상향으로 통과하면 구매 신호가 발생하여 시장이 상승 추세를 보일 수 있음을 나타냅니다. 빠른 이동 평균이 느린 이동 평균을 상향으로 통과하면 판매 신호가 발생하여 시장이 하향 추세를 보일 수 있음을 나타냅니다.
전략 원칙
이 전략의 기술적 원리는 트렌드 지표로서의 이동 평균의 특성에 기초한다. 구체적인 구현 세부 사항은 다음과 같다:
- 쌍평선 시스템: 전략은 두 개의 다른 주기의 간단한 이동 평균을 사용하며, 기본적으로 각각 10 주기 ((빠른 선) 및 30 주기 (( 느린 선) 이다.
- 신호 생성 논리:
- 구매 신호: 빠른 SMA에 느린 SMA를 통과할 때
ta.crossover함수 판단) - 팔기 신호: 빠른 SMA 아래에서 느린 SMA를 통과할 때
ta.crossunder함수 판단)
- 구매 신호: 빠른 SMA에 느린 SMA를 통과할 때
- 거래 집행 메커니즘:
- 구매 신호가 트리거를 쏘아올렸을 때, 더 많은 입장을 실행합니다.
- 팔기 신호가 터졌을 때, 공백을 실행하고 입점
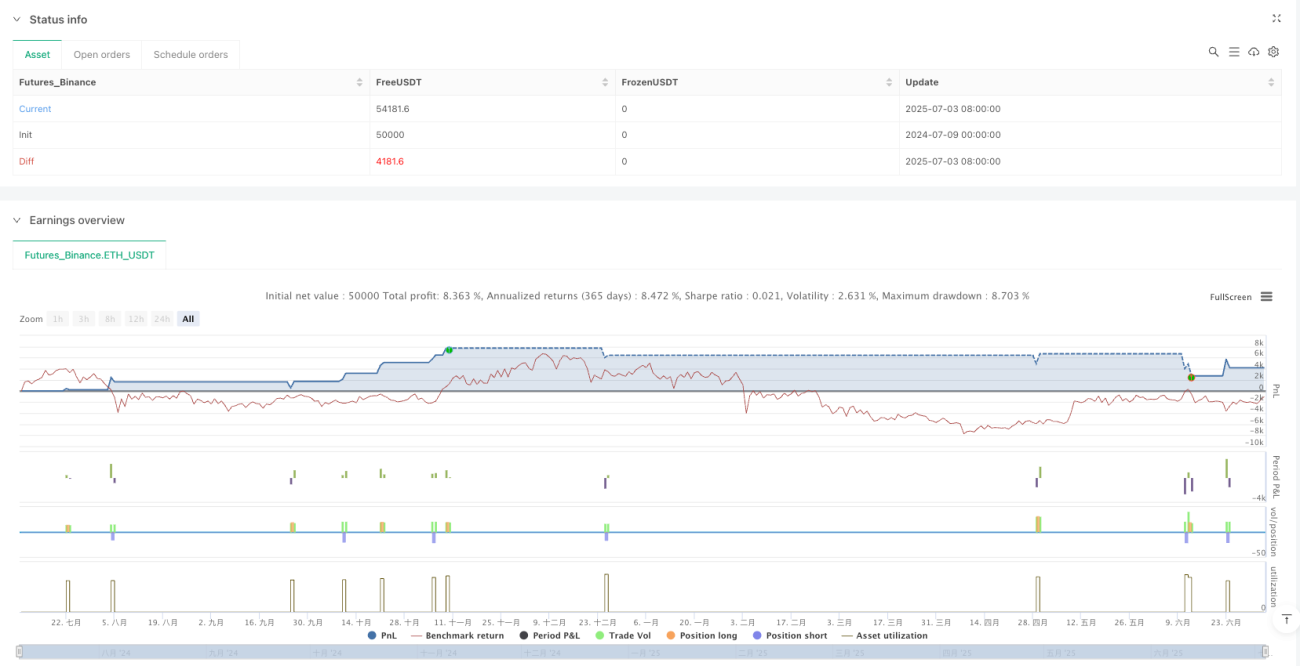
- 위험 관리 시스템:
- 정지 설정: 입점 가격의 고정 비율 (예작 0.10%) 에 따라 수익 목표를 설정
- 스톱로스 설정: 입시 가격의 일정한 비율 (비례 0.10%) 에 따라 최대 손실 제한을 설정
- 시각화 컴포넌트:
- 쌍평선 그리기: 다른 색상 (~ 파란색과 오렌지색) 과 선폭 표시 빠른 느린 평선
- 신호 표기: 다공간 신호는 다른 모양과 색상의 화살표를 사용
- 기둥 모양의 색채: 현재 트렌드 방향에 따라 가격 기둥에 색을 표시합니다.
코드 구현에서, 이 전략은 TradingView Pine 스크립트 V6 버전을 사용하며,strategy함수집합은 트랜잭션 논리를 구현하고plot그리고plotshape함수 가시화를 구현하고 동시에 설정alertcondition트랜잭션 알림으로 쓰입니다.
전략적 이점
이 전략의 코드 구현을 분석하면 다음과 같은 몇 가지 중요한 장점을 찾을 수 있습니다.
- **간결하고 효율적입니다.**전략 논리는 간단하고 이해하기 쉽고, 복잡한 계산이 포함되지 않고, 계산 효율이 높습니다.
- 적응력: 쌍평선 시스템은 다양한 시장 환경과 주기에 적응할 수 있으며, 매개 변수가 조정할 수 있다.
- 완벽한 위험 관리융합된 스톱 스톱 손실 메커니즘, 각 거래에 대해 명확한 탈퇴 조건을 설정하고, 단일 거래의 위험을 효과적으로 제어한다.
- 다 시장 적용성: 코드 구조는 주식, 암호화폐, 외환, 지수 등 다양한 거래 품종에 적용된다.
- 높은 비주얼리티: 명확한 시각적 피드백을 제공하며, 평행선 이동, 입시 신호 표시 및 기둥 모양의 색상의 변화를 포함하여 거래자가 시장 상태를 직관적으로 이해할 수 있도록합니다.
- 자금 관리의 유연성: 자본의 비율 모드를 사용하여 포지션을 관리합니다. 기본으로 100%의 자금을 사용하지만 필요에 따라 조정할 수 있습니다.
- 완전 자동화전략의 실행은 완전히 자동화될 수 있고, 인간의 개입과 감정적 요소의 영향을 줄일 수 있다.
- 실시간 경고 기능: 내장된 거래 신호 경고 조건, 거래자가 시장 기회를 잡을 수 있도록 도와줍니다.
전략적 위험
이 전략은 합리적으로 설계되었지만 다음과 같은 잠재적인 위험과 한계가 있습니다.
- 시장의 위조 신호: 가로 디스크 정리 또는 흔들리는 시장에서, 쌍평선 시스템은 빈번한 교차 신호를 생성할 수 있으며, 이로 인해 연속적인 스톱 손실이 발생한다. 해결책은 트렌드 확인 지표 또는 거래량 확인과 같은 필터링 조건을 추가하는 것이다.
- 뒤처진 문제: 뒤떨어진 지표로서, 이동 평균은 트렌드 전환점에서 일반적으로 느리게 반응하며, 이상적인 진입 지점을 놓치거나 출전을 지연할 수 있다. 선두 지표와 결합하거나 평균선 주기를 줄이는 것을 고려하여 이 문제를 줄일 수 있다.
- 고정 비율 위험 설정은 유연하지 않습니다.: 현재 스톱 스톱 손실 설정은 고정 비율을 사용하며 시장의 변동성 차이를 고려하지 않습니다. 개선 방향은 ATR 또는 변동성에 기반한 동적 스톱 손실 메커니즘을 도입하는 것입니다.
- 철수 통제의 부재: 전략에는 최대 인출 제한이나 전체 위험 제어 장치가 설정되어 있지 않다. 최대 손실 제한이나 연속 손실 횟수 제한을 추가하는 것이 좋습니다.
- 매개변수 민감도이중 평행 주기 설정은 전략 성능에 중요한 영향을 미치며, 다른 시장과 시간 프레임에 따라 다른 매개 변수가 필요할 수 있습니다. 충분한 매개 변수 최적화 및 재검토가 필요합니다.
- 과도한 거래의 위험: 특정 시장 조건에서, 전략은 과도한 거래를 유발하여 거래 비용을 증가시킬 수 있습니다. 거래 필터 또는 냉각 기간을 추가하여 거래 주파수를 제어 할 수 있습니다.
- 거래비용을 고려하지 않고: 코드에서 거래 수수료 및 슬라이포인트의 영향이 명시적으로 포함되지 않았기 때문에 피드백 결과가 너무 낙관적이 될 수 있습니다. 실제 적용 시 이러한 요소를 고려해야합니다.
전략 최적화 방향
코드 분석을 바탕으로, 이 전략은 다음과 같은 방향으로 최적화될 수 있습니다:
- 동적 중지 중지 손실고정된 비율의 스톱 로프를 ATR 또는 역사적인 변동성에 기반한 동적 메커니즘으로 대체하여 다양한 시장 조건의 변동성에 적응합니다. 고정 비율이 높은 변동성과 낮은 변동성 시장에서 일치하지 않을 수 있기 때문입니다.
- 트렌드 강도 필터링트렌드 강도를 측정하기 위해 ADX 또는 유사한 지표를 도입하고, 트렌드가 분명할 때만 거래를 실행하여, 흔들리는 시장에서 가짜 신호를 줄여줍니다. 이것은 전략의 승률을 효과적으로 향상시킬 수 있습니다.
- 거래량 확인: 거래량 조건이 추가되어 교차 신호의 보조 확인으로 신호의 신뢰성을 높인다. 거래량은 종종 트렌드의 진실성에 대한 중요한 증거이다.
- 변수 적응 메커니즘: 시장 조건에 따라 자동으로 평균 주기를 조정하는 메커니즘을 개발하여 전략의 적응성을 향상시킵니다. 예를 들어, 높은 변동성 시장에서 더 긴 평균 주기가 필요할 수 있습니다.
- 다시 접속할 수 있는 로직을 추가합니다.: 스톱 손실이 발생했지만 트렌드 신호가 여전히 유효할 때, 지속되는 트렌드를 파악하기 위해 재입장 논리를 설계한다.
- 위험 관리 강화: 하루 최대 손실 제한, 연속 손실 횟수 제한 등의 위험 제어 장치를 추가하여 계좌 자금을 보호하십시오.
- 시간 필터특정 시장을 대상으로 시간 필터를 추가하여 낮은 유동성 또는 높은 변동성 시기를 피하십시오.
- 다중 시간 프레임 분석: 상위 시간 프레임의 트렌드 방향을 통합하는 거래 필터링 조건으로, 여러 시간 프레임의 트렌드가 일치하는 경우에만 거래한다.
- 포지션 규모 관리 최적화: 신호의 강도, 시장의 변동성 또는 역사적 승률의 동성에 따라 거래당 자금의 비율을 조정합니다. 100%의 자금을 고정적으로 사용하지 않습니다.
- 부드러운 알고리즘에 가입: EMA를 SMA의 대안으로 사용하거나 교차 신호를 부드럽게 처리하여 잘못된 거래 신호를 줄이는 것을 고려하십시오.
이러한 최적화 방향은 주로 신호 품질을 향상시키고, 위험 관리를 강화하고, 전략 적응력을 향상시키는 세 가지 측면을 대상으로 실제 거래 요구에 따라 선택적으로 구현할 수 있습니다.
요약하다
쌍평선 교차로로 막대기 중단 손실의 트렌드 거래량 전략은 기술 분석의 고전적 이론과 현대적 위험 관리를 결합한 거래 시스템이다. 이 전략은 빠른 속도와 느린 속도 이동 평균 사이의 관계를 모니터링하여 시장의 추세를 판단하고 중요한 교차로에서 거래 신호를 발생시키며, 각 거래에 대한 사전 이익 목표와 손실 제한을 설정한다.
전략의 주요 장점은 논리적으로 간결하고 이해하기 쉽고 실행 가능하며, 좋은 시각화 효과와 위험 제어 메커니즘을 갖추고 있다는 것입니다. 그러나, 일률선 기반 시스템으로서, 신호 지연 및 변동 시장에서 가짜 신호 발생과 같은 전형적인 도전에 직면합니다.
다이내믹 스톱스 메커니즘, 트렌드 강도 필터링, 멀티 타임 프레임 분석과 같은 최적화 방법을 도입함으로써 전략의 성능과 적응력을 크게 향상시킬 수 있습니다. 거래자에게는 전략의 작동 원리와 한계를 이해하고 개인 위험 선호와 함께 적절한 조정을하는 것이 전략의 성공적인 적용의 핵심입니다.
마지막으로, 모든 거래 전략은 실제 적용되기 전에 충분한 역사 회수와 전향 검증이 필요하며, 다른 시장 환경과 거래 품종의 특성에 따라 타겟 조정됩니다.
/*backtest
start: 2024-07-09 00:00:00
end: 2025-07-04 08:00:00
period: 1d
basePeriod: 1d
exchanges: [{"eid":"Futures_Binance","currency":"ETH_USDT"}]
*/

//@version=6
strategy("SMA Crossover Strategy with TP/SL", overlay=true, initial_capital=10000, default_qty_type=strategy.percent_of_equity, default_qty_value=100)

// --- Inputs ---- 1