
개요
다중 지표 동적 스윙 전략은 4시간 차트를 위해 설계된 종합 거래 시스템입니다. 이 전략은 다섯 가지 핵심 기술 지표의 상호 작용을 통해 시장 상승 추세에서 스윭 기회를 정밀하게 포착합니다. 추세 추종과 조정 매수(롱)의 장점을 결합하여 EMA로 상승 추세를 확인하고, RSI로 모멘텀을 검증하며, MACD로 방향을 확인하고, 거래량 분석으로 돌파 신뢰도를 강화하며, 피보나치 되돌림 수준을 활용해 최적의 진입점을 찾고, ATR 기반 동적 위험 관리 시스템으로 자금을 보호합니다.
전략 원리
다중 지표 동적 스윙 전략은 다섯 가지 보완 지표의 동시 확인 메커니즘에 기반합니다:
-
EMA 추세 필터: 50기간 지수이동평균(EMA)을 주요 추세 필터로 사용합니다. 가격이 EMA 위에 있을 때만 롱(매수) 기회를 고려하여 거래 방향이 주요 추세와 일치하도록 합니다.
-
RSI 모멘텀 확인: 상대강도지수(RSI)가 40 이상일 뿐만 아니라 연속 3기간 상승해야 하며, 이를 통해 가격 모멘텀 상승을 검증합니다. 동시에 RSI>70을 과매수 청산 조건으로 설정하여 고점 위험을 효과적으로 회피합니다.
-
MACD 상승 크로스: MACD 라인이 시그널 라인을 상향 돌파할 때 방향성 확인 신호를 제공합니다. 표준 12/26/9 설정을 사용하지만 사용자가 시장 특성에 맞게 조정할 수 있습니다.
-
거래량 돌파 검증: 거래량이 20기간 평균의 1.5배 이상인지 확인하여 가격 돌파 강도와 신뢰도를 검증하고, 가짜 돌파 함정을 피합니다.
-
피보나치 되돌림 지지: 최근 변동 고점과 저점을 기준으로 피보나치 되돌림 수준을 동적으로 계산하여 가격이 38.2%~61.8% 지지 구간으로 되돌릴 때 이상적인 진입점을 제공하며, 추세 방향에서 저위험 진입을 실현합니다.
위험 관리 시스템은 14기간 ATR(평균 실제 변동 범위)을 기반으로 동적 손절(진입가 아래 2×ATR)과 이익 목표(진입가 위 3×ATR)를 설정하여 위험-보상 비율 1:1.5의 합리적인 구성을 실현합니다.
전략 장점
-
다중 확인 메커니즘: 다섯 가지 다양한 차원의 기술 지표가 동시에 확인되어 거래 신호의 신뢰성을 크게 높이고 가짜 신호 간섭을 줄여 강력한 필터링 시스템을 구축합니다.
-
동적 적응성: 모든 지표 매개변수는 다양한 시장 환경과 거래 상품 특성에 맞게 조정 가능하여 높은 유연성과 적응성을 제공합니다.
-
정밀한 진입 타이밍: 추세 확인과 피보나치 되돌림 지지를 결합하여 추세 방향에서 위험이 최소화되고 잠재적 수익이 최대화되는 진입점을 찾아 추세 추종 매수의 고위험을 피합니다.
-
위험 관리 체계: ATR 기반 동적 손절 및 이익 설정으로 시장 변동성에 따라 위험 통제가 자동 조정되어 다양한 변동 환경에서 일관된 위험-보상 특성을 유지합니다.
-
시각적 의사결정 지원: 전략은 진입/청산 신호 표시, 조건 정보 테이블, 멀티 패널 지표 표시 등 명확한 그래픽 인터페이스를 제공하여 거래 결정의 직관성과 편의성을 크게 향상시킵니다.
-
종합 알림 시스템: 내장된 진입 및 청산 신호 알림 기능으로 트레이더가 중요한 거래 기회를 놓치지 않도록 보장하여 전략 실행의 적시성을 높입니다.
전략 리스크
-
역사적 백테스팅 과의존: 백테스팅에서 우수한 성과를 보일 수 있지만, 시장 조건 변화로 인해 미래 성과가 과거와 다를 수 있습니다. 실전 투입 전 충분한 포워드 테스트와 소액 자금 검증을 권장합니다.
-
매개변수 최적화 리스크: 특정 역사적 데이터에 과도하게 적합된 매개변수 설정은 미래 시장에서 무효화될 수 있습니다. 과도한 최적화를 피하고 합리적이고 견고한 매개변수 설정을 유지해야 합니다.
-
신호 중첩 지연: 다섯 지표가 동시에 충족되는 조건은 시간적으로 지연될 수 있어 잠재적 수익 일부를 놓칠 수 있습니다. MACD 히스토그램 변화나 RSI 방향 변화를 조기 경고로 도입하는 것을 고려할 수 있습니다.
-
추세 반전 리스크: 이 전략은 명확한 추세 시장에 주로 적합하며, 횡보장이나 급변동 시장에서는 잦은 가짜 신호가 발생할 수 있습니다. 변동성 필터나 시장 상태 분류 모듈을 추가하여 이 리스크를 회피할 수 있습니다.
-
고정 승수 리스크: ATR을 사용한 동적 손절/이익 설정에도 불구하고 고정된 ATR 승수(2와 3)가 모든 시장 환경에 적합하지 않을 수 있습니다. 변동성이 극단적으로 변하는 시장에서는 ATR 승수를 동적으로 조정하는 것을 고려해야 합니다.
전략 최적화 방향
-
적응형 승수 조정: 시장 변동 상태에 따라 ATR 승수를 동적으로 조정할 수 있습니다. 예를 들어 저변동성 시장에서는 더 큰 승수를, 고변동성 시장에서는 더 작은 승수를 사용하여 위험-보상 특성을 최적화합니다. 구현 코드는 과거 ATR의 표준편차를 계산하여 현재 변동 상태를 판단할 수 있습니다.
-
시간 필터 통합: 거래 시간 필터를 도입하여 주요 경제 데이터 발표 시간대와 같은 특정 고변동성 또는 저효율 시간대를 회피합니다. 이는 bar_index와 거래 시간 조건을 확인하여 구현할 수 있습니다.
-
시장 상태 분류: 시장 상태 분류 모듈을 개발하여 추세 시장과 횡보 시장을 구분하고, 각 상태에 따라 다른 전략 매개변수나 거래 로직을 적용합니다. ADX 지표나 가격과 다중 기간 이동평균의 관계를 통해 구현할 수 있습니다.
-
동적 포지션 관리: 시장 상황과 신호 강도에 기반한 동적 포지션 크기 관리 시스템을 구현하여 고신뢰 신호 시 포지션을 늘리고 약한 신호 시 줄입니다. 이는 각 지표 조건 충족 강도를 평가하여 구현할 수 있습니다.
-
부분 이익 실현 메커니즘: 분할 이익 실현 메커니즘을 도입하여 특정 이익 목표 도달 시 일부 포지션을 청산함으로써 일부 이익을 확보하면서 상승 여력을 남깁니다. 이는 strategy.exit 함수의 qty_percent 매개변수를 통해 구현할 수 있습니다.
요약
다중 지표 동적 스윙 전략은 EMA 추세 필터, RSI 모멘텀 확인, MACD 방향 검증, 거래량 돌파 확인, 피보나치 되돌림 지지 등 다섯 가지 차원의 협력을 통해 트레이더에게 고품질의 롱(매수) 신호를 제공하는 포괄적이고 견고한 거래 시스템입니다. 이 전략은 신뢰할 수 있는 신호 생성 메커니즘뿐만 아니라 ATR 기반 동적 위험 관리 시스템을 갖추고 있어 중장기 스윙 트레이더에게 적합합니다.
적응형 승수 조정, 시간 필터, 시장 상태 분류, 동적 포지션 관리, 부분 이익 실현 메커니즘 등의 최적화 방향을 도입함으로써 이 전략은 다양한 시장 환경에서 안정성과 수익성을 더욱 향상시킬 수 있습니다. 체계적이고 명확한 규칙을 갖추며 위험 통제가 가능한 거래 방법을 찾는 투자자에게 다중 지표 동적 스윙 전략은 고려할 만한 선택지를 제공합니다.
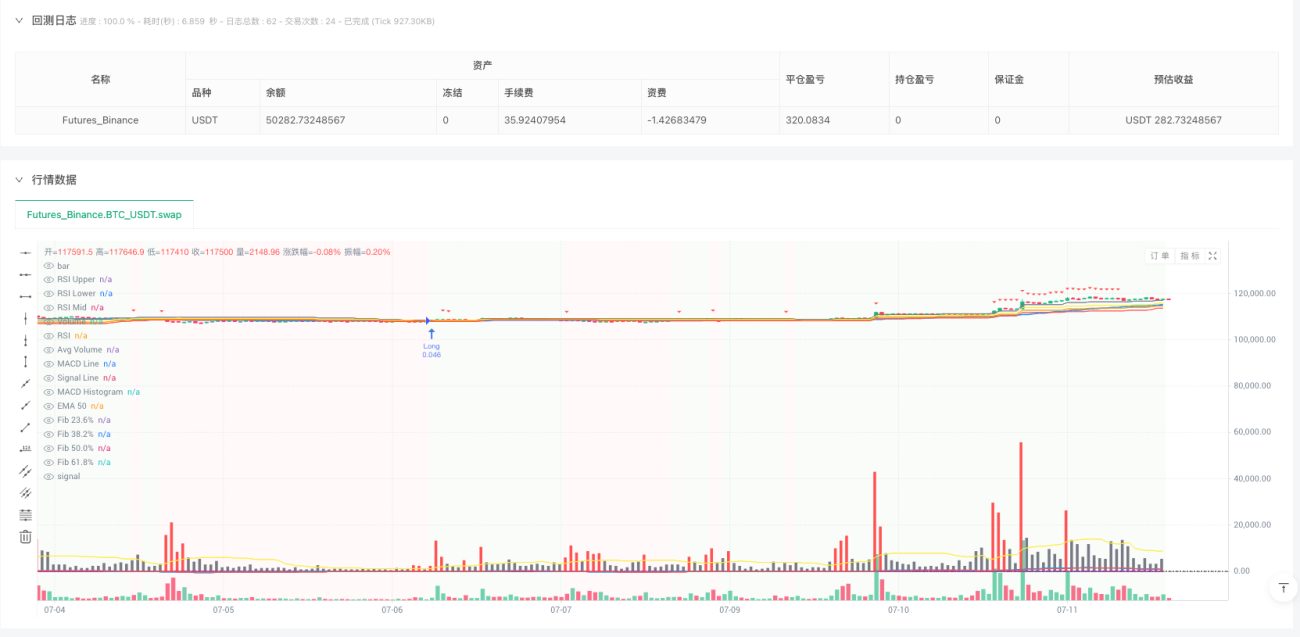
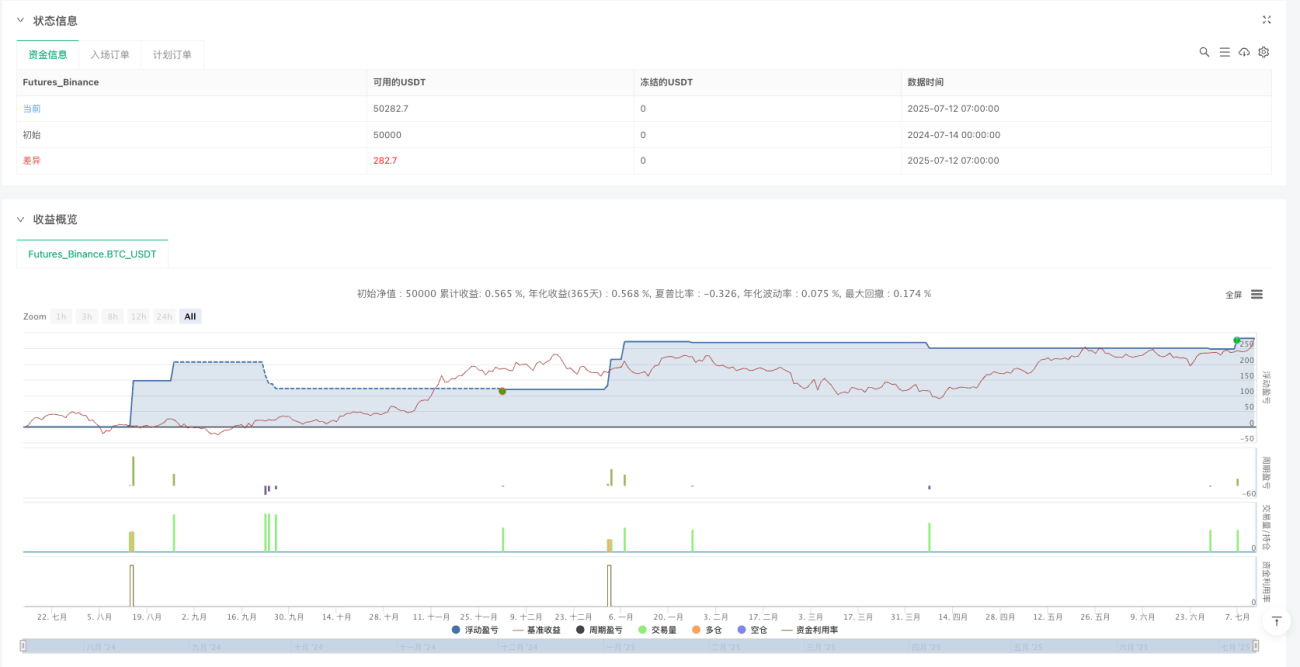
/*backtest
start: 2024-07-14 00:00:00
end: 2025-07-12 08:00:00
period: 1h
basePeriod: 1h
exchanges: [{"eid":"Futures_Binance","currency":"BTC_USDT"}]
*/

// This Pine Script® code is subject to the terms of the Mozilla Public License 2.0 at https://mozilla.org/MPL/2.0/
// © robert-angel
//@version=5
strategy("5-Indicator Swing Strategy", overlay=true, default_qty_type=strategy.percent_of_equity, default_qty_value=10)- 1