
개요
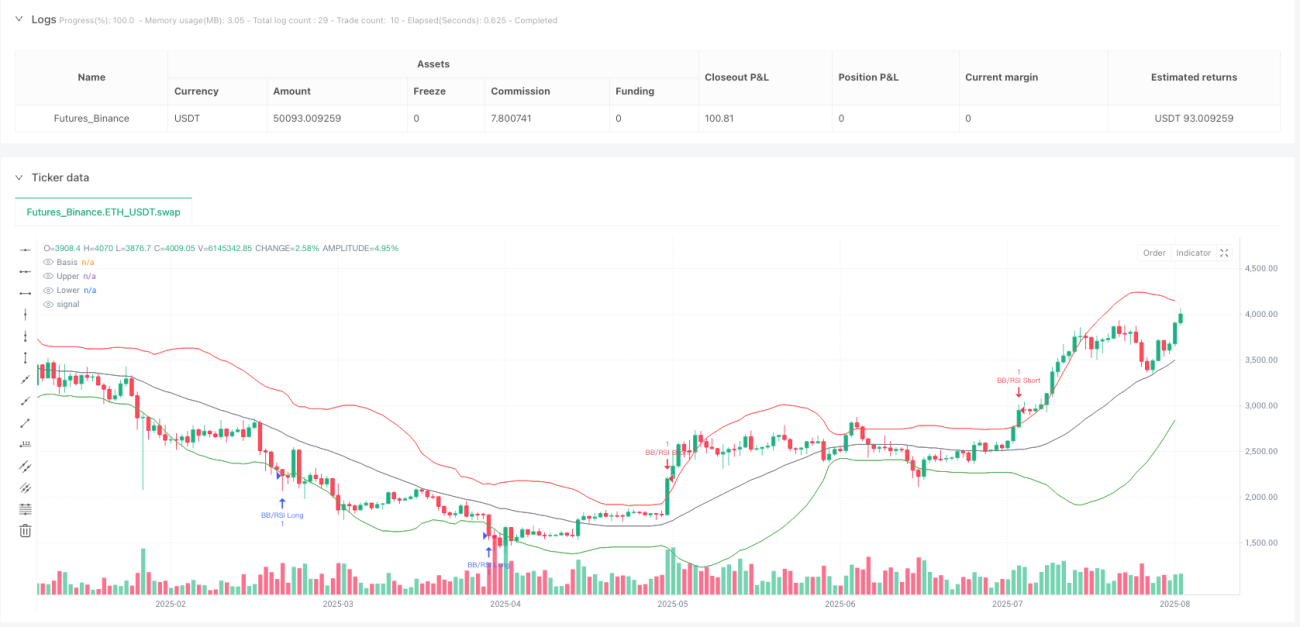
본 전략은 볼린저 밴드와 RSI 지표를 결합하여 이중 확인 방식을 통해 잠재적인 시장 반전 지점을 식별합니다. 가격이 하단 볼린저 밴드를 돌파하고 RSI가 과매도 조건을 확인하면 매수 포지션에 진입하고, 가격이 상단 볼린저 밴드를 돌파하고 RSI가 과매수 조건을 확인하면 매도 포지션에 진입합니다. 이 전략은 동시에 고정 손절매와 트레일링 손절매 메커니즘을 적용하여 리스크를 관리하며, 높은 확률의 반전 거래 기회를 포착하는 동시에 자금 안전을 보호하는 것을 목표로 합니다.
전략 원리
이 전략은 평균 회귀 원리와 모멘텀 확인 메커니즘에 기반하여 작동합니다. 볼린저 밴드는 최근 변동성 대비 가격 극단값을 식별하는 데 도움을 주고, RSI는 시장이 실제로 과매수 또는 과매도 상태인지 확인합니다. 핵심 원리는 다음과 같습니다:
- 볼린저 밴드(표준편차 기반 SMA 주변 변동대)를 사용하여 가격이 평균에서 크게 벗어나는 시점을 식별합니다.
- RSI 수치를 통해 잠재적 반전을 확인하고 허위 신호를 필터링합니다.
- 고정 손절매와 트레일링 손절매를 결합한 종합 리스크 관리 메커니즘을 구현합니다.
- 동일한 기술적 원리를 기반으로 매수 및 매도 기회를 거래합니다.
코드 구현에서 전략은 30일 주기의 SMA를 사용하여 볼린저 밴드 중앙선을 계산하고, 표준편차 승수는 2.0이며, 14일 주기의 RSI를 모멘텀 확인 지표로 사용합니다. 가격이 상단 밴드를 돌파하고 RSI가 70 이상일 때 매도 신호가 발생하고, 가격이 하단 밴드를 돌파하고 RSI가 30 이하일 때 매수 신호가 발생합니다. 또한 각 거래마다 고정 40포인트 손절매와 40포인트 트레일링 손절매가 적용되어 리스크가 통제 가능하도록 보장합니다.
전략의 장점
- 이중 확인 메커니즘은 가격 움직임(볼린저 밴드)과 모멘텀(RSI)이 동시에 조건을 충족하도록 요구하여 허위 신호를 줄입니다.
- 평균 회귀 방법은 시장이 극단적인 변동 후 평균으로 회귀하는 경향을 활용합니다.
- 유연한 매개변수 설정은 다양한 시장 조건과 거래 상품에 전략을 적용할 수 있게 합니다.
- 고정 손절매와 트레일링 손절매를 동시에 사용하는 종합 손절매 전략은 자본을 보호하고 이익을 확보하는 데 도움이 됩니다.
- 비교적 간단한 구현으로 전략을 이해하기 쉬우면서도 시장 노이즈를 필터링할 만큼 충분히 복잡합니다.
- 전략의 대칭성은 동일한 원리를 사용하여 매수 및 매도 기회를 처리할 수 있게 합니다.
- 코드 구조가 명확하고 매개변수화된 설계로 인해 다양한 시장 특성에 맞게 최적화 및 조정이 가능합니다.
전략의 위험
- 강력한 추세 시장에서 평균 회귀 전략은 연속적인 다중 손실을 겪을 수 있습니다.
- 고정 손절매 값은 다양한 시장 변동성에서 항상 최적을 유지하지 못할 수 있습니다.
- 지속적인 추세에서 RSI와 볼린저 밴드가 오랜 기간 극단적인 영역에 머물러 조기 진입을 초래할 수 있습니다.
- 40포인트 고정 손절매 값은 거래 상품 및 일반적인 가격 범위에 따라 자동 조정되지 않습니다.
- 포지션 관리 로직이 부족하여 거래 간 리스크 노출이 불균형해질 수 있습니다.
- 시간 기반 청산 메커니즘이 없으면 변동장에서 포지션 보유 시간이 너무 길어질 수 있습니다.
- 높은 변동성 환경에서 고정 손절매 포인트가 자본을 보호하기에 충분하지 않을 수 있습니다.
전략 최적화 방향
- ATR(평균 실제 범위) 또는 과거 변동성을 기반으로 한 적응형 손절매 및 트레일링 손절매 값을 구현합니다.
- 강한 추세 시장에서 역추세 거래를 피하기 위해 추세 필터를 추가합니다.
- 거래량 확인을 통합하여 신호 품질을 향상시킵니다.
- 변동성 또는 리스크 지표를 기반으로 한 동적 포지션 관리를 개발합니다.
- 과도한 포지션 보유를 방지하기 위해 시간 기반 청산 규칙을 추가합니다.
- 대체 볼린저 밴드 계산 방법(예: SMA 대신 EMA 사용, 다른 표준편차 승수)을 테스트합니다.
- 보조 확인 지표를 추가하여 진입 시점을 최적화합니다.
- 전체 위험-보상 비율을 개선하기 위해 부분 이익 실현 규칙을 추가하는 것을 고려합니다.
- 변동성 조정 메커니즘을 도입하여 다양한 변동성 환경에서 전략이 더 안정적으로 작동하도록 탐구합니다.
요약
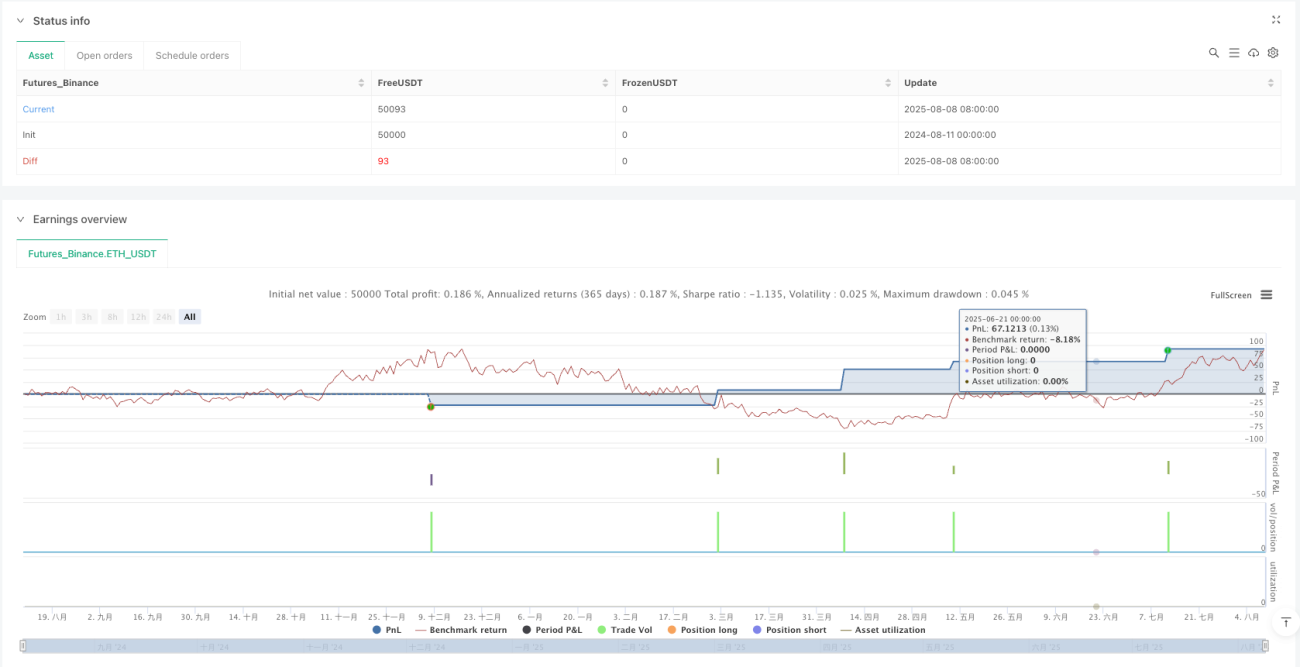
볼린저 밴드-RSI 이중 확인 평균 회귀 전략과 트레일링 손절매 보호는 시장 반전 거래에 대한 신중한 접근 방식을 나타냅니다. 볼린저 밴드의 변동성 신호와 RSI의 모멘텀 확인을 결합함으로써 이 전략은 허위 신호를 필터링하면서 높은 확률의 반전 지점을 포착하는 것을 목표로 합니다. 내장된 리스크 관리 메커니즘은 고정 및 트레일링 손절매를 통해 중요한 보호 계층을 제공합니다. 이 전략은 이중 확인을 통한 잠재적 반전 지점 식별에 분명한 장점이 있지만, 특히 다양한 시장 조건 적응 및 더 복잡한 포지션 관리와 청산 메커니즘 구현 측면에서 추가 최적화의 이점을 얻을 수 있습니다. 전반적으로 이는 신호 품질과 리스크 관리를 균형 있게 조화시킨 평균 회귀 거래 방법의 견고한 기초입니다.
/*backtest
start: 2024-08-11 00:00:00
end: 2025-08-09 08:00:00
period: 1d
basePeriod: 1d
exchanges: [{"eid":"Futures_Binance","currency":"ETH_USDT"}]
*/

//@version=5
strategy("BB & RSI Trailing Stop Strategy", overlay=true, initial_capital=10000)

// --- Inputs for Bollinger Bands, RSI, and Trade Management ---- 1