다중 주기 슈퍼 트렌드 EMA 모멘텀 필터링 전략

개요
이 전략은 슈퍼트렌드(Supertrend) 지표와 다중 모멘텀 필터를 결합한 고급 추세 추종 시스템으로, 강력한 추세를 포착하도록 설계되었습니다. 핵심은 ATR(평균 진폭)을 기반으로 동적으로 조정되는 슈퍼트렌드 지표에 EMA(지수 이동 평균)와 DEMA(이중 지수 이동 평균)를 추세 확인 도구로 활용하고, RSI(상대 강도 지수) 및 거래량 필터를 통합하여 진입 신호의 신뢰도를 높이는 데 있습니다. 이 전략은 ATR 기반의 손절매, 이익 실현 및 트레일링 스탑 메커니즘을 내장하고 있으며, 다양한 거래 스타일에 맞춰 여러 시간대의 사전 설정 파라미터를 제공합니다. 특히 주목할 점은 상승 추세 중 조정 시 재진입할 수 있는 스마트 재진입 로직이 있어 연속적인 상승 흐름을 포착할 수 있다는 것입니다.
전략 원리
이 전략의 핵심 원리는 다층 신호 확인 메커니즘을 기반으로 한 포괄적인 거래 결정 프레임워크입니다:
-
슈퍼트렌드 핵심 신호 시스템: ATR을 이용해 동적 추세 밴드를 계산하며, 종가가 하단선을 돌파하면 매수 신호(상향 전환), 상단선을 돌파하면 매도 신호(하향 전환)를 생성합니다. ATR 기간과 승수는 다양한 시장 환경의 변동성에 맞게 조정 가능합니다.
-
모멘텀 확인 필터: 가격이 단기 EMA(기본 21주기)와 장기 DEMA(기본 200주기) 위에 위치하도록 요구하여 거래 방향이 주요 추세와 일치하도록 하고 역추세 거래를 방지합니다.
-
신호 강도 검증: RSI(기본 50 초과)로 가격 모멘텀을 확인하고, 거래량이 EMA(기본 20주기)보다 큰지 확인하여 시장 참여도를 높여 진입 신호의 품질을 향상시킵니다.
-
스마트 재진입 메커니즘: 확인된 상승 추세에서 가격이 조정 후 다시 EMA 위에 안착하고 다른 조건을 만족할 경우 전략이 재진입하여 추세 지속 중 기회를 효과적으로 포착합니다.
-
리스크 관리 시스템:
- 손절매는 진입가 아래 1 ATR(기본)에 설정
- 이익 실현은 진입가 위 3 ATR(선택 사항)에 설정
- 이익이 1 ATR을 초과하면 트레일링 스탑 메커니즘을 가동하여 일부 이익을 확보합니다.
-
다중 주기 파라미터 사전 설정:
- "Auto-1H/4H": ATR 주기 10, 승수 3, 단기 스윙 트레이딩에 적합
- "Auto-1D": ATR 주기 14, 승수 3, 일봉 추세 추종에 적합
- "Auto-1W": ATR 주기 20, 승수 4, 장기 추세 포착에 적합
전략 장점
이 전략은 심층 분석을 통해 다음과 같은 뚜렷한 장점을 가지고 있습니다:
-
적응성 우수: 슈퍼트렌드 지표는 ATR 기반으로 동적으로 조정되어 시장 변동성 변화에 자동으로 적응하며, 다양한 시장 환경에서 효과성을 유지합니다.
-
다층 확인으로 가짜 신호 감소: EMA, DEMA, RSI 및 거래량의 다중 검증을 통해 가짜 신호 위험이 크게 줄어들고 거래 품질이 향상됩니다.
-
스마트 재진입으로 연속성 흐름 포착: 혁신적인 재진입 로직으로 상승 추세 중 조정 후 재진입이 가능하여 추세 내 변동을 효과적으로 활용하고 자금 효율성을 높입니다.
-
완벽한 리스크 관리 체계: ATR 기반의 손절매, 이익 실현 및 트레일링 스탑 메커니즘이 내장되어 단일 거래 손실을 제한하고 획득 이익을 효과적으로 보호하며 하락 리스크를 줄입니다.
-
다중 주기 사전 설정으로 운용 간소화: 다양한 시간 프레임에 맞춰 사전 설정된 파라미터로 여러 거래 주기에서 전략을 쉽게 구현할 수 있으며, 다양한 거래자의 시간 선호도에 적응합니다.
-
직관적이고 명확한 시각적 보조: 색상 채우기로 상승 및 하락 추세를 구분하고, 명확한 매매 신호 표시를 통해 시장 상태를 한눈에 파악할 수 있어 거래 결정에 용이합니다.
-
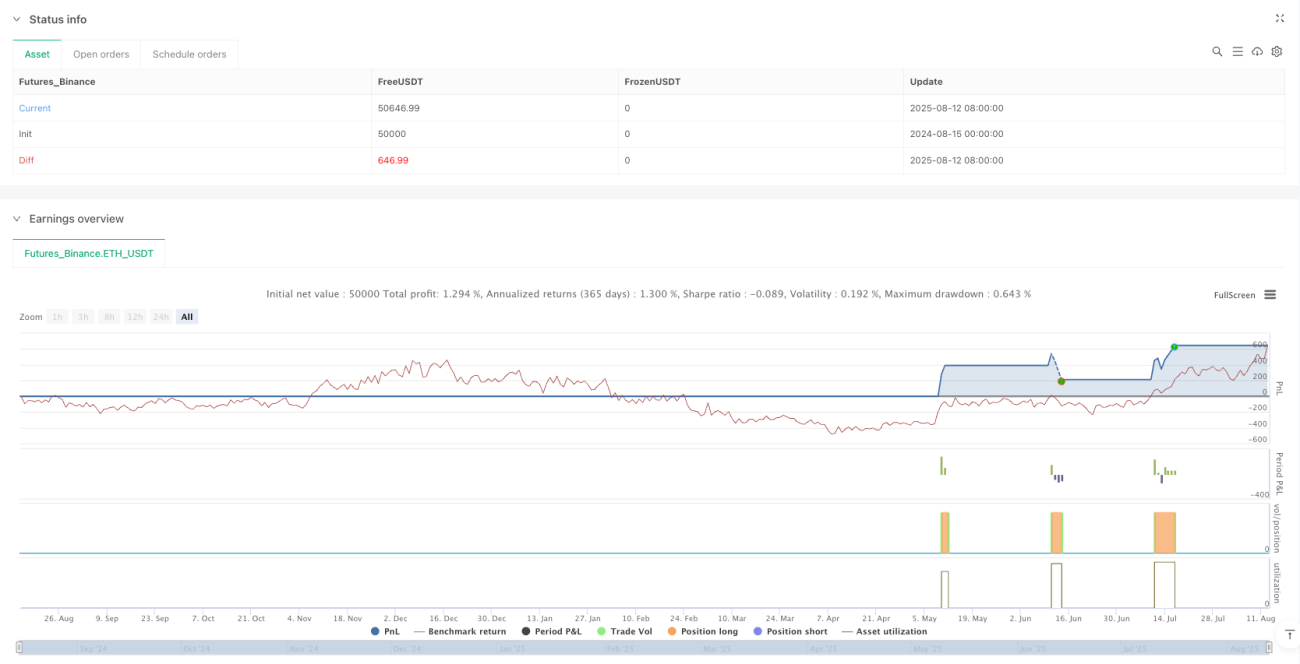
실제 백테스트 검증 완료: 일봉 주기에서 약 60%의 승률과 4 이상의 이익 계수를 보여주며, 특히 추세가 뚜렷한 시장 환경에 적합합니다.
전략 리스크
이 전략이 포괄적으로 설계되었음에도 불구하고 다음과 같은 잠재적 리스크가 존재합니다:
-
횡보장에서 성과 저하: 명확한 추세가 없는 횡보장에서는 손절매가 빈번하게 발생하여 연속적인 소액 손실이 누적될 수 있습니다. 해결책은 시장 구조가 명확하지 않을 때 거래를 중단하거나 ATR 승수를 높여 신호 민감도를 낮추는 것입니다.
-
필터 조건으로 인한 일부 기회 상실 가능성: 다중 필터 조건은 신호 품질을 높이지만 초기 추세 기회를 놓칠 수도 있습니다. 거래자는 개인 리스크 선호도에 따라 필터 조건의 엄격함을 조정할 수 있습니다.
-
파라미터 민감도: ATR 주기와 승수 설정이 전략 성과에 큰 영향을 미치며, 시장 환경에 따라 다른 파라미터가 필요할 수 있습니다. 특정 시장에 대한 파라미터 설정을 백테스트를 통해 최적화하는 것이 좋습니다.
-
하락 리스크: 백테스트 결과 전액 포지션 사용 시 최대 손실폭이 크게(최대 100% 이상) 나타날 수 있습니다. 반드시 엄격한 자금 관리를 수행하고, 각 거래 리스크를 1~2% 이내로 제한해야 합니다.
-
역사 데이터의 한계: 전략이 주로 특정 시장 및 기간에 대해 백테스트되었으므로 과적합 위험이 있을 수 있습니다. 실전 적용 전에 더 넓은 시장과 기간에 걸친 테스트가 필요합니다.
-
극단적 시장 조건 테스트 부족: 전략이 시장의 급격한 변동이나 유동성 위기와 같은 극단적 상황에서 테스트되지 않았을 수 있으며, 이러한 상황에서의 성과는 알 수 없습니다.
최적화 방향
코드 심층 분석을 통해 이 전략은 다음과 같은 방향으로 최적화가 가능합니다:
-
적응형 파라미터 조정: 시장 변동성에 기반하여 ATR 승수와 주기를 동적으로 조정하는 메커니즘을 개발하여 전략이 시장 상태 변화에 자동으로 적응하도록 합니다. 예를 들어 변동성이 증가하면 ATR 승수를 높이고 변동성이 감소하면 ATR 승수를 낮춥니다.
-
시장 상태 분류 통합: 시장이 추세인지 횡보인지에 따라 전략 파라미터를 자동으로 조정하거나 거래를 중단하는 시장 상태 인식 모듈(예: 볼린저 밴드 폭, ADX 등)을 도입합니다.
-
다중 주기 분석 프레임워크: 더 높은 시간 프레임의 추세가 현재 시간 프레임과 일치해야 거래를 실행하도록 하는 다중 주기 분석 기능을 추가하여 추세 판단의 정확성을 높입니다.
-
재진입 로직 최적화: 재진입 조건을 세분화하여 피보나치 되돌림 수준이나 주요 지지선 확인 등을 추가함으로써 재진입 지점의 정밀도를 높일 수 있습니다.
-
자금 관리 최적화: 시장 변동성, 계정 순자산 및 연속 손익 상태에 따라 포지션 크기를 자동으로 조정하는 동적 포지션 관리를 구현하여 자금 곡선 성능을 최적화합니다.
-
시장 심리 지표 추가: VIX(변동성 지수)나 거래량 변화율과 같은 시장 심리 지표를 통합하여 시장 공황 또는 과도한 낙관 시 전략 행동을 조정합니다.
-
머신러닝 최적화: 머신러닝 알고리즘을 활용하여 파라미터 선택 및 진입 타이밍을 최적화하고, 과거 데이터를 통해 최적의 거래 파라미터 조합을 예측하는 모델을 훈련합니다.
요약
다중 주기 슈퍼트렌드 EMA 모멘텀 필터 전략은 잘 설계된 추세 추종 시스템으로, 슈퍼트렌드 지표와 다중 모멘텀 필터를 결합하여 포괄적인 거래 결정 프레임워크를 구축했습니다. 핵심 장점은 적응성 우수, 다층 확인으로 가짜 신호 감소, 스마트 재진입으로 연속성 흐름 포착, 완벽한 리스크 관리 체계에 있습니다. 이 전략은 특히 추세가 뚜렷한 시장 환경에 적합하며, 일봉 주기에서 좋은 백테스트 성과를 보였습니다.
그러나 이 전략은 횡보장에서 성과가 저하될 수 있으며, 파라미터 민감도 및 잠재적 하락 리스크가 존재합니다. 전략의 견고성을 더욱 높이기 위해 적응형 파라미터 조정 개발, 시장 상태 분류 통합, 다중 주기 분석 프레임워크 구축, 재진입 로직 최적화, 자금 관리 방식 개선, 시장 심리 지표 추가 및 머신러닝 기술 적용을 고려할 수 있습니다.
결론적으로, 이 전략은 추세 추종 거래에 기술적 지표가 엄격하고 리스크 관리가 완벽한 프레임워크를 제공하지만, 사용 시 항상 리스크 관리의 중요성을 명심하고 각 거래의 리스크를 수용 가능한 범위 내로 제한하며 개인 거래 스타일과 시장 환경에 맞게 전략 파라미터를 적절히 조정해야 합니다.
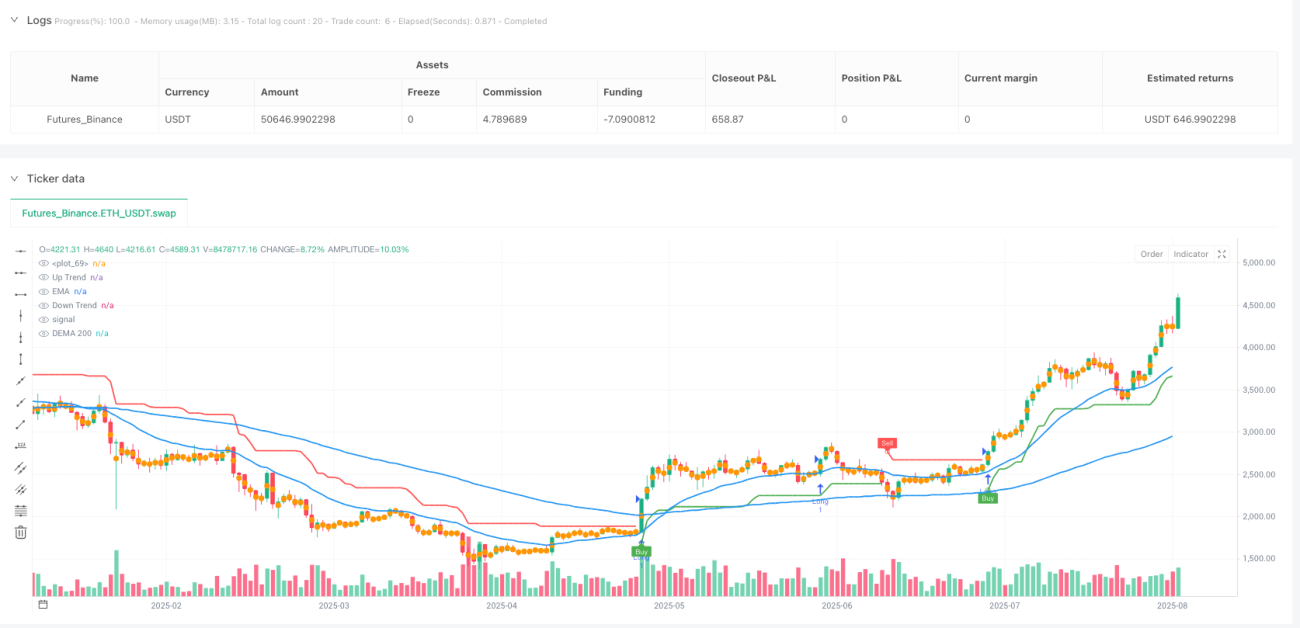
/*backtest
start: 2024-08-15 00:00:00
end: 2025-08-13 08:00:00
period: 1d
basePeriod: 1d
exchanges: [{"eid":"Futures_Binance","currency":"ETH_USDT"}]
*/

//@version=5
strategy("Supertrend EMA Strategy _V29", overlay=true, format=format.price, precision=2, initial_capital=1000)
// Inputs
tf_preset = input.string("Manual", title="Timeframe Preset", options=["Manual", "Auto-1H/4H", "Auto-1D", "Auto-1W"])- 1