
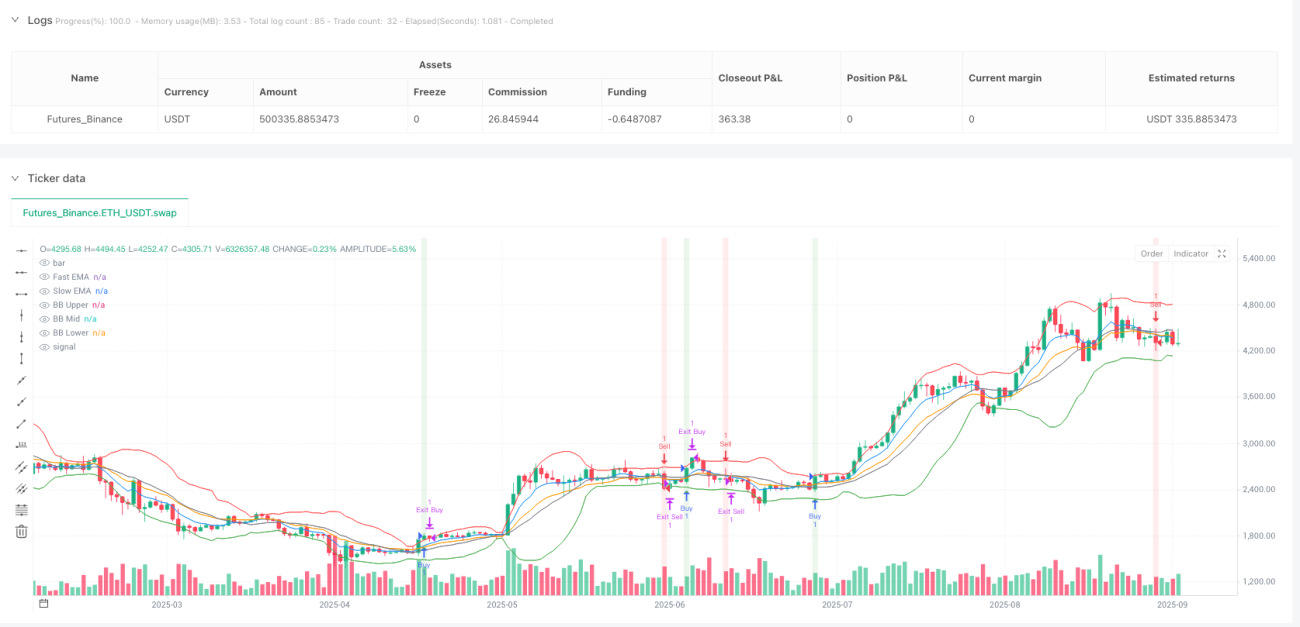
🚀 이 전략은 얼마나 강력할까?
아시나요? 이 전략은 마치 여러분의 트레이딩에 "불안정한 눈"을 장착해 주는 것과 같습니다! 1분과 5분의 초단타 트레이딩을 위해 특별히 설계되었으며, 5가지 가장 강력한 기술적 지표를 결합합니다: 빠른/느린 EMA, RSI, MACD, 볼린저 밴드, 그리고 거래량 필터. 간단히 말해, 시장의 모든 작은 변동에서 정확하게 기회를 포착할 수 있게 해줍니다!
💡 핵심 포인트! 이 조합은 어떻게 작동할까?
상상해 보세요. 이 전략은 마치 매우 엄격한 "면접관"과 같아서, 여러 조건을 동시에 충족하는 거래 기회만 통과시킬 수 있습니다:
매수 신호는 반드시 충족해야 함: 가격이 빠른 EMA 위에 있고, MACD가 골든크로스이며 양수이고, 볼린저 밴드 상단을 돌파했으며, RSI가 50-80 사이에 있고, 충분한 거래량이 뒷받침되어야 합니다. 이는 마치 한 사람에게 외모도 뛰어나고, 재능도 있으며, 성격도 좋아야 한다고 요구하는 것처럼 엄격합니다!
매도 신호는 반대: 모든 조건이 반대로 충족되어야 하며, 모든 거래가 충분한 기술적 지지 기반을 갖추도록 보장합니다.
⚡ 함정 피하기: 왜 초단타를 선택할까?
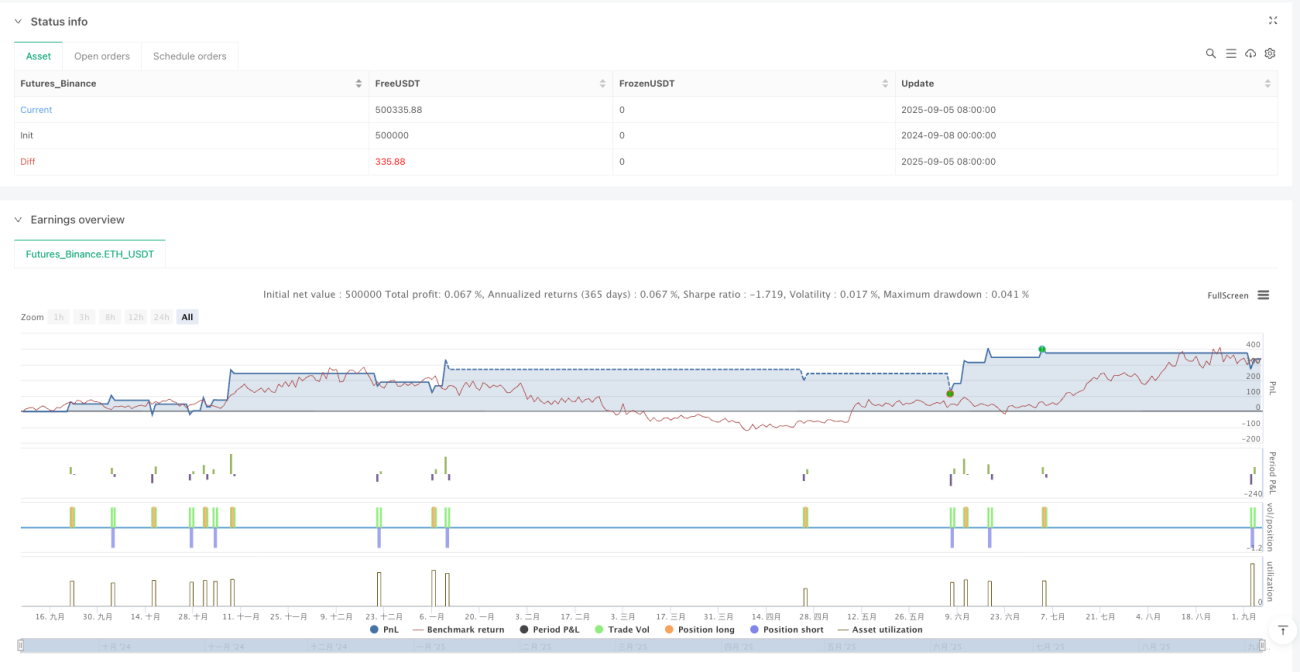
이 전략의 가장 똑똑한 점은 위험 관리에 있습니다! 손절매는 0.5%, 이익 실현은 1.0%로 설정되어 위험 보상 비율이 1:2에 달합니다. 마치 "작은 도박으로 즐거움을 얻는다"는 완벽한 해석과 같습니다 - 매번 손실은 매우 작지만, 수익은 두 배가 될 수 있습니다!
또한 세심한 설계가 있습니다: 1분 차트에서는 자동으로 캔들스틱 패턴 인식을 끕니다. 초단타의 캔들 패턴은 노이즈가 너무 많아 판단을 오도할 수 있기 때문입니다. 이는 마치 시끄러운 환경에서 자동으로 소음을 줄이는 것처럼 똑똑합니다!
🎯 실전 적용: 이 전략이 어떤 문제를 해결해 줄까?
적합한 대상: 암호화폐 시장에서 데이트레이딩을 원하는 분들, 특히 작고 빈번한 거래를 통해 수익을 쌓고자 하는 트레이더에게 적합합니다.
해결하는 문제: 단일 지표의 잘못된 신호에 대한 고민을 던져 주세요! 다중 확인 메커니즘을 통해 신호의 신뢰성을 크게 향상시킵니다. 동시에 엄격한 위험 관리는 잘못된 판단을 해도 손실이 통제 가능한 범위 내에 있도록 보장합니다.
기억하세요, 이 전략은 정밀한 메스와 같아서 유동성이 높은 암호화폐 페어에서 사용할 때 가장 효과적입니다. 적절한 자금 관리와 결합하면, 여러분의 트레이딩 무기고에서 든든한 조력자가 될 것입니다!
/*backtest
start: 2024-09-08 00:00:00
end: 2025-09-06 08:00:00
period: 1d
basePeriod: 1d
exchanges: [{"eid":"Futures_Binance","currency":"ETH_USDT","balance":500000}]
*/

//@version=5
strategy("Advanced Crypto Scalping Strategy - 1 & 5 Min Charts", overlay=true, margin_long=100, margin_short=100)

// Inputs for customization (optimized for 1-min and 5-min timeframes)- 1