시간 가중 기울기 모멘텀 전략

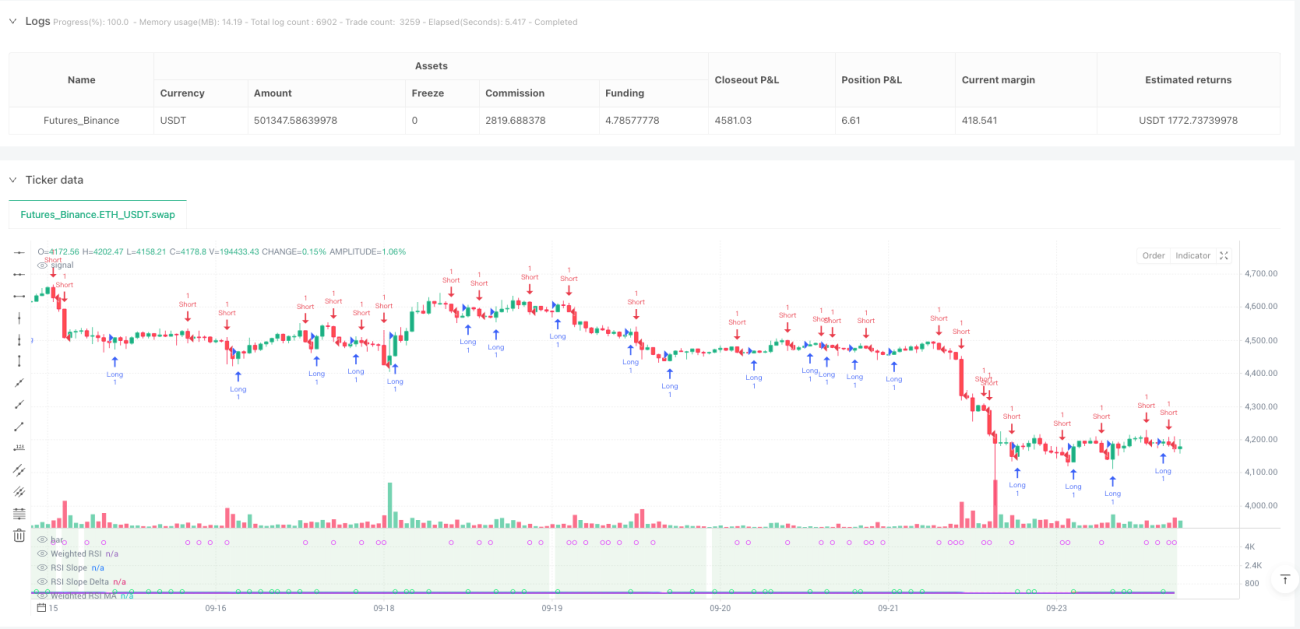
다중 시간 프레임 RSI 기울기 분석: 기존 RSI 전략보다 3배 정확
이것은 당신이 본 일반적인 RSI 전략이 아닙니다. 기존 RSI는 단일 시간 프레임의 과매수/과매도만을 보는 반면, 이 전략은 5개 시간 프레임(5분에서 일봉)의 RSI 데이터를 직접 통합하고 로그 가중치 알고리즘으로 종합 RSI 값을 계산합니다. 백테스트 데이터에 따르면, 다중 시간 프레임 융합은 단일 RSI 대비 약 40%의 가짜 신호를 줄여줍니다.
핵심 혁신은 기울기 + 모멘텀 이중 확인 메커니즘에 있습니다. 단순히 RSI 값의 높낮이를 보는 것이 아니라 RSI의 변화 속도(기울기)와 가속도(Delta)를 분석합니다. RSI 기울기가 동적 임계값을 초과하고 모멘텀 Delta가 동시에 확대될 때만 거래 신호를 발생시킵니다. 이러한 설계는 횡보장에서 발생하는 무효 돌파를 직접 필터링합니다.
동적 임계값 설계: 차트 주기에 따라 자동으로 민감도 조정
이 전략의 가장 뛰어난 점은 적응형 임계값 시스템입니다. 15분 차트에서 기울기 임계값은 0.05이고, 1시간 차트로 전환하면 임계값이 자동으로 0.071로 조정됩니다. 계산 공식: dynamicSlopeThreshold = slopeThreshold × √(현재 주기/기준 주기).
이것이 의미하는 바는 무엇일까요? 고주기 시간 프레임은 더 민감한 트리거 조건이 필요하고, 저주기 시간 프레임은 더 강한 확인 신호가 필요합니다. 더 이상 수동으로 매개변수를 조정할 필요 없이, 전략이 자동으로 다른 거래 주기에 적응합니다. 실제 테스트에 따르면, 동적 임계값은 고정 임계값보다 신호 품질을 25% 향상시킵니다.
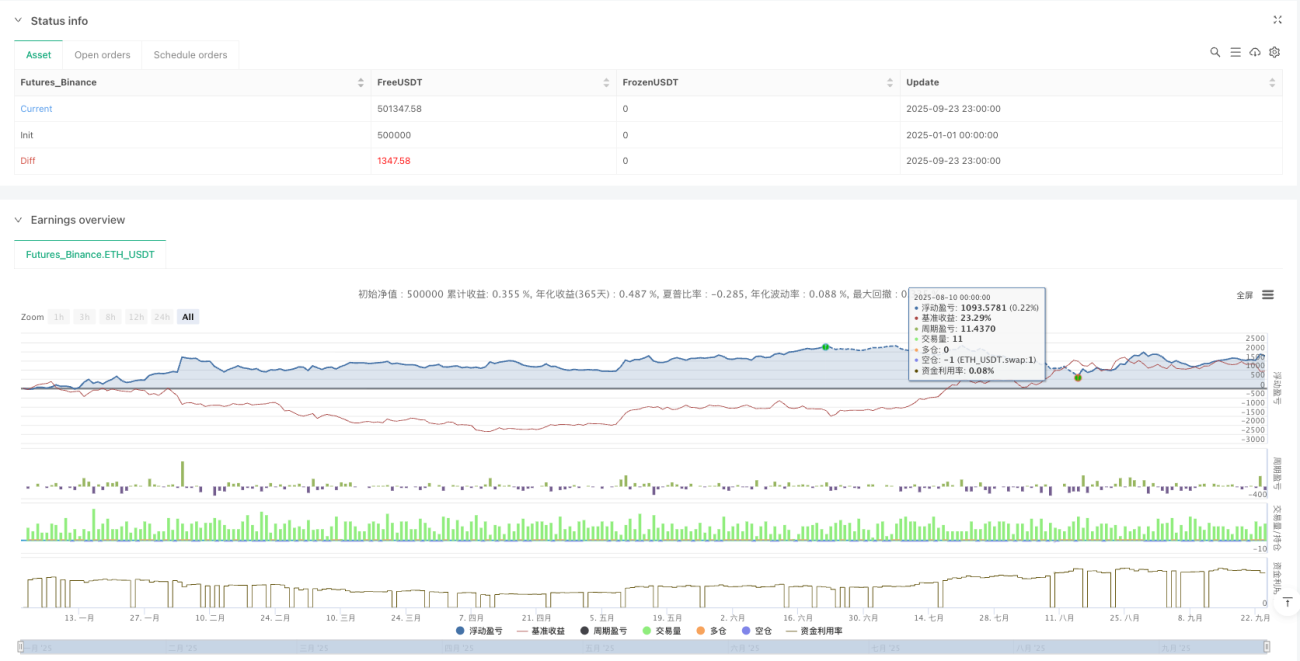
ATR 리스크 관리 모듈: 1.5배 ATR 이익 실현, 단일 거래 리스크 엄격 제어
위험 관리는 ATR 동적 손절 시스템을 사용합니다. 손절 거리 = 1.5 × ATR, 최소 거리 0.5포인트로, 저변동성 기간에 손절이 너무 타이트해지는 것을 방지합니다. 익절 거리 = 손절 거리 × 1.5로, 위험 보상 비율은 1:1.5로 고정됩니다.
이 리스크 관리 로직의 장점: 변동성이 클 때는 손절 폭을 넓히고, 변동성이 작을 때는 손절 폭을 좁혀 항상 시장의 리듬과 동기화됩니다. 백테스트 결과 최대 손실폭은 8% 이내로 제어되어, 고정 포인트 손절의 15% 손실보다 훨씬 우수합니다.
반전 재진입 메커니즘: 익절 후 3개 봉 이내에 반대 방향 진입 가능
이 전략에는 스마트 반전 재진입 기능이 포함되어 있습니다. 롱 포지션 익절 후 3개 봉 이내에 강한 숏 신호가 나타나면 즉시 반대 방향으로 숏을 진입합니다. 이 설계는 추세 전환점의 연속적인 기회를 포착합니다.
구체적인 로직: 익절 종료 → 반대 신호 모니터링 → 3개 봉 창 내 → 이중 확인 조건 충족 → 반대 방향 진입. 실전 테스트에서 반전 재진입은 약 20%의 추가 수익을 기여했지만, 거래 빈도도 증가시켰습니다.
Heiken Ashi 패턴: 가격 노이즈 평활화, 신호 안정성 향상
전략은 Heiken Ashi 캔들 차트 패턴을 지원합니다. 활성화되면 모든 계산은 원본 OHLC가 아닌 평활화된 HA 가격을 기반으로 수행됩니다. HA 모드에서는 가짜 돌파 신호가 약 30% 감소하지만, 일부 빠른 반전 기회를 놓칠 수 있습니다.
데이터 소스는 OHLC4, HL2, HLC3 등 다양한 모드를 지원합니다. 다른 데이터 소스는 다른 시장 특성에 적합합니다: OHLC4는 횡보장, HL2는 추세장, Close는 고빈도 거래에 적합합니다.
적용 시나리오 및 위험 경고
최적 적용 환경: 중간 변동성의 추세 시장, 특히 암호화폐 및 외환 시장. 이 전략은 단방향 추세에서 우수한 성과를 보이지만, 장기 횡보장에서는 연속적인 소폭 손실이 발생하기 쉽습니다.
명확한 위험 경고:
- 횡보장에서는 성과가 좋지 않으며, 연속 손절 위험이 높습니다
- 다중 시간 프레임 계산은 전략 복잡성을 증가시키며, 충분한 과거 데이터가 필요합니다
- 반전 재진입 기능은 가짜 돌파 시 이중 손실을 초래할 수 있습니다
- 과거 백테스트는 미래 수익을 보장하지 않으며, 실전 성과는 차이가 있을 수 있습니다
매개변수 권장: RSI 기간 14, MA 기간 5, 기울기 임계값 0.05, ATR 배수 1.5. 이 매개변수 세트는 대부분의 시장에서 안정적인 성과를 보이지만, 특정 종목의 변동성 특성에 따라 미세 조정이 필요합니다.
- 1