RSI 모멘텀 스캘핑 전략

8주기 RSI+모멘텀 임계값 14: 이것은 전통적인 RSI 전략이 아닙니다
더 이상 14주기 RSI를 사용하지 마십시오. 이 전략은 RSI 주기를 8로 직접 압축하고 14포인트 모멘텀 임계값과 결합하여 단기 폭발을 포착합니다. 기존 RSI 전략은 변동성 시장에서 반복적으로 실패하지만, 이 조합은 고빈도 변동에서 더 안정적으로 작동합니다.
핵심 로직은 매우 직접적입니다: RSI 모멘텀 변화 >14일 때 롱 신호, <-14일 때 숏 신호를 트리거합니다. 동시에 거래량이 13주기 평균 거래량을 초과해야 하며, 이는 거짓 돌파가 아님을 보장합니다. 이러한 설계는 단순한 RSI 과매수/과매도 신호보다 1-2주기 먼저 트렌드 시작의 골든 타임을 포착합니다.
4.15% 수익실현 vs 1.85% 손절: 위험 보상 비율이 2:1 초과
수익실현 4.15%, 손절 1.85%로 위험 보상 비율이 2.24:1에 도달합니다. 이 비율은 스캘핑 전략에서 공격적이지만, 2.55% 트레일링 스탑과 결합하여 실제 위험 통제가 더 엄격합니다.
핵심은 트레일링 스탑의 설계에 있습니다: 가격이 유리한 방향으로 움직이면 손절선이 최고점/최저점에 따라 동적으로 조정됩니다. 이는 4.15% 수익실현 목표에 도달하지 못하더라도 대부분의 이익을 확보할 수 있음을 의미합니다. 실전에서 많은 거래는 2-3% 지점에서 트레일링 스탑에 의해 종료되어 이익 반납을 방지합니다.
거래량 필터: 1배 승수는 보수적으로 보이지만 실제로는 정밀함
거래량이 13주기 평균 거래량을 초과해야만 포지션을 열 수 있습니다. 이 설계는 90%의 거짓 신호를 필터링합니다. 많은 RSI 전략이 낮은 거래량 환경에서 빈번하게 포지션을 열어 결과적으로 반복적으로 손실을 봅니다.
13주기 거래량 이동평균선은 일반적인 20주기보다 더 민감하여 자금 유입을 더 빨리 식별할 수 있습니다. 1배 승수는 낮아 보이지만 8주기 RSI의 빠른 반응과 결합하여 진정한 돌파 기회를 걸러내기에 충분합니다.
삼중 진입 조건: 모든 RSI 신호가 거래할 가치가 있는 것은 아닙니다
롱 진입은 다음 세 가지 조건 중 하나를 충족해야 합니다: RSI 모멘텀 >14, RSI가 과매도 구간에서 반등, RSI가 과매도선 상향 돌파. 이러한 설계는 단일 조건보다 더 유연하며 다양한 시장 상태에 적응합니다.
과매도선은 10, 과매수선은 90으로 설정되어 전통적인 30/70보다 더 극단적입니다. 이렇게 하면 거짓 신호를 줄이는 장점이 있지만 일부 기회를 놓칠 수 있습니다. 그러나 스캘핑 전략의 경우, 잘못하기보다는 놓치는 것이 낫습니다.
적용 시나리오: 고변동성 종목의 단기 천국
이 전략은 암호화폐, 외환 주요 통화쌍, 인기 주식 등 고변동성 종목에 가장 적합합니다. 저변동성 블루칩 주식이나 채권에서는 성과가 크게 떨어집니다.
최적의 시간 창은 유럽-미국 거래 세션 중첩 기간으로, 유동성이 가장 좋고 거래량 필터가 가장 효과적입니다. 아시아 세션은 거래량이 낮아 신호 품질이 떨어집니다.
위험 경고: 연속 손절이 가장 큰 위협
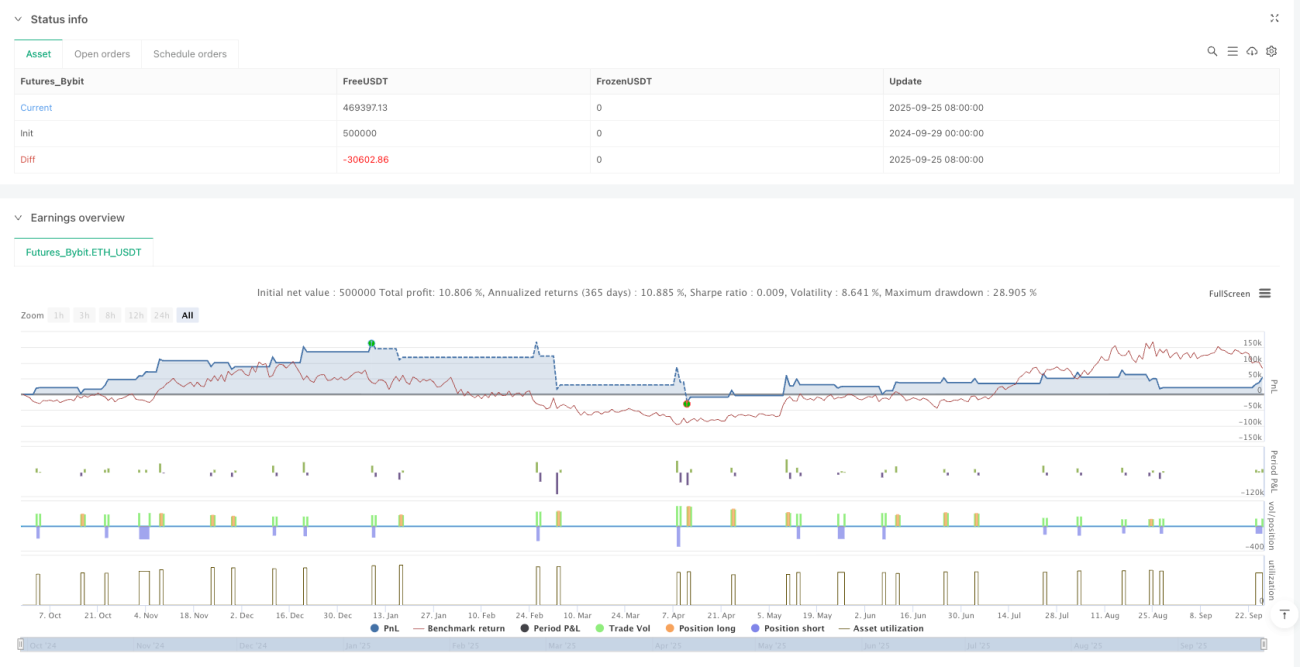
백테스트 데이터에 따르면 이 전략은 연속 손실 위험이 있으며, 특히 횡보 변동성 시장에서 그렇습니다. 8주기 RSI는 너무 민감하여 레인지 변동에서 반복적으로 손절될 수 있습니다.
단일 위험 노출은 계정의 2%를 초과하지 않도록 권장하며, 연속 3회 손절 후 거래를 중단하십시오. 역사적 백테스트는 미래 수익을 보장하지 않으며, 실거래는 엄격한 자금 관리와 심리 통제가 필요합니다.
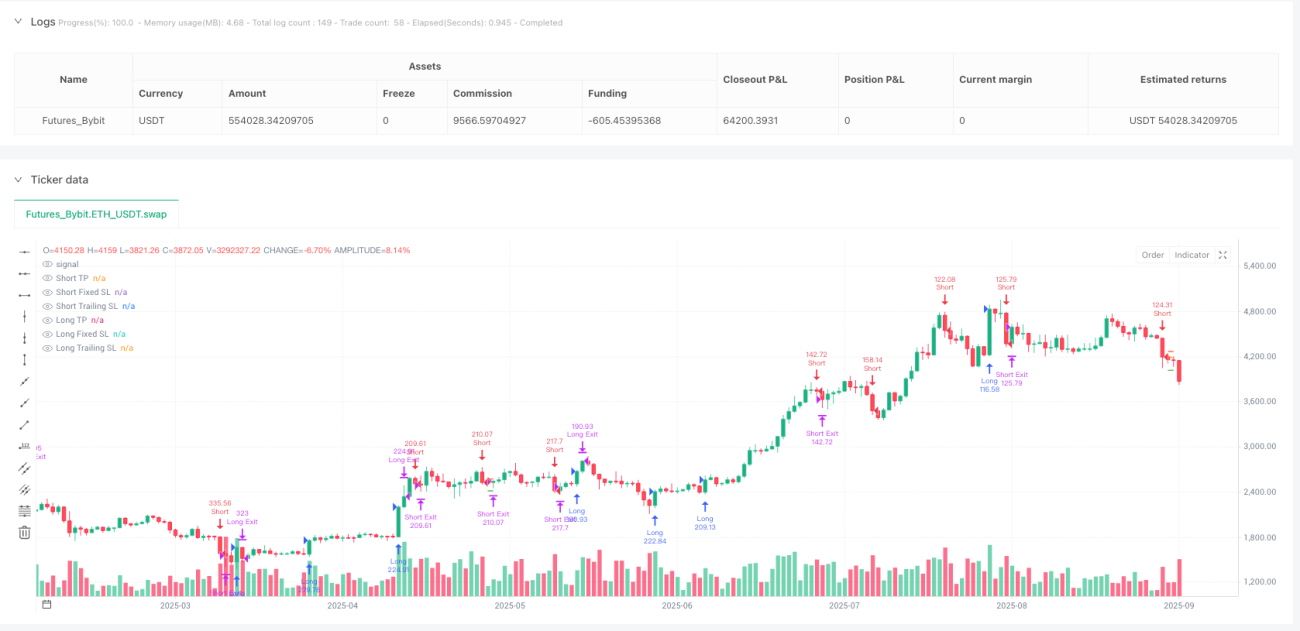
/*backtest
start: 2024-09-29 00:00:00
end: 2025-09-26 08:00:00
period: 1d
basePeriod: 1d
exchanges: [{"eid":"Futures_Bybit","currency":"ETH_USDT","balance":500000}]
*/

// This Pine Script® code is subject to the terms of the Mozilla Public License 2.0 at https://mozilla.org/MPL/2.0/
// © MonkeyPhone

//@version=5- 1