三重共振捕捉策略

3가지 지표가 2개 캔들 내에 동시에 신호를 보내야 한다. 그렇지 않으면 논외
이것은 일반적인 다중 지표 전략이 아니다. WaveTrend + Connors RSI + 선형 회귀 편차의 조합에서 핵심은 윈도우 동기화 메커니즘이다. 모든 매수 신호는 2개 캔들 범위 내에서 나타나야 하며, 단독 신호는 무시된다. 이러한 설계는 가짜 신호의 90%를 직접 걸러낸다.
전통적인 전략은 각 지표가 독립적으로 판단하여 노이즈를 발생시키거나, 동시에 트리거를 요구하여 많은 기회를 놓친다. 이 전략은 균형점을 찾았다: 2개 캔들의 오차 허용 윈도우는 신호의 상관성을 보장하면서도 너무 엄격한 동기화 요구를 피한다.
WaveTrend 설정 -48 과매도선, 표준 RSI보다 더 민감
WT 길이는 10주기로 설정하고, 과매도선은 -48, 과매수선은 48이다. 이 매개변수 조합은 전통적인 RSI의 30/70보다 더 공격적이며, 가격 반전 신호를 더 일찍 포착할 수 있다. WT의 장점은 가격 위치와 변동성을 결합하여, 변동장에서 단순 RSI보다 더 신뢰할 수 있다는 점이다.
핵심은 WT의 계산 방식이다: (전형적 가격 - EMA) / (0.015 * 편차의 EMA). 이 공식은 본질적으로 변동성 조정 기능을 갖추고 있다. 시장 변동성이 커지면 분모가 커져 WT 값이 상대적으로 안정적이 되어, 고변동 기간 동안 일반 RSI의 왜곡 문제를 피할 수 있다.
Connors RSI 삼중 검증, 20/80 임계값 설정에 깊은 의미
CRSI는 일반 RSI가 아니다. 가격 RSI, 연속 상승/하락 RSI, 가격 변화 백분위 순위를 융합한다. 20의 과매도 임계값은 전통적인 30보다 더 공격적이지만, CRSI의 삼중 검증 메커니즘은 가짜 신호 확률을 낮춘다.
6주기 RSI 길이는 비교적 짧게 설정하여 신호 민감도를 높이기 위함이다. 15분봉에서 6주기는 약 1.5시간의 가격 기억에 해당하며, 단기 과매도를 포착하면서도 과도한 지연을 피할 수 있다. 이 매개변수는 BTC와 같이 24시간 거래되는 종목에 특히 효과적이다.
선형 회귀 편차 LSDD, 20주기로 추세 전환 포착
LSDD = 현재 가격 - 선형 회귀 값. LSDD가 0선을 상향 돌파하면 가격이 하락 추세선에서 벗어나기 시작했음을 의미한다. 20주기 설정은 15분봉에서 5시간을 커버하며, 중단기 추세 변화를 효과적으로 식별할 수 있다.
이 지표의 정교함은 단순한 추세 추종이 아니라 추세 편차 측정에 있다. 가격이 지속적으로 하락한 후 회귀선에서 위로 벗어나기 시작하면, 이는 반등의 시작을 예고하는 경우가 많다. WT 및 CRSI의 과매도 신호와 결합하여 "과매도 + 추세 전환"의 이중 확인을 형성한다.
롱 포지션만, 30% 자금, 1배 피라미딩
전략은 순수 롱 전용으로 설계되었으며, 매번 30% 자금으로 포지션을 열고 1회 추가 매수를 허용한다. 이 설정은 암호화폐의 장기 상승 추세에 적합하면서도 포지션 제어를 통해 리스크를 관리한다. 30%의 단일 포지션은 충분한 수익을 얻을 수 있으면서도 단일 거래의 과도한 리스크를 피한다.
청산 조건 역시 엄격하다: WT 과매수(>48) AND CRSI 과매수(>80) AND LSDD 음전환, 세 가지 조건이 동시에 충족되어야 한다. 이러한 설계는 추세 거래의 완전성을 보장하고 조기 이탈을 방지한다.
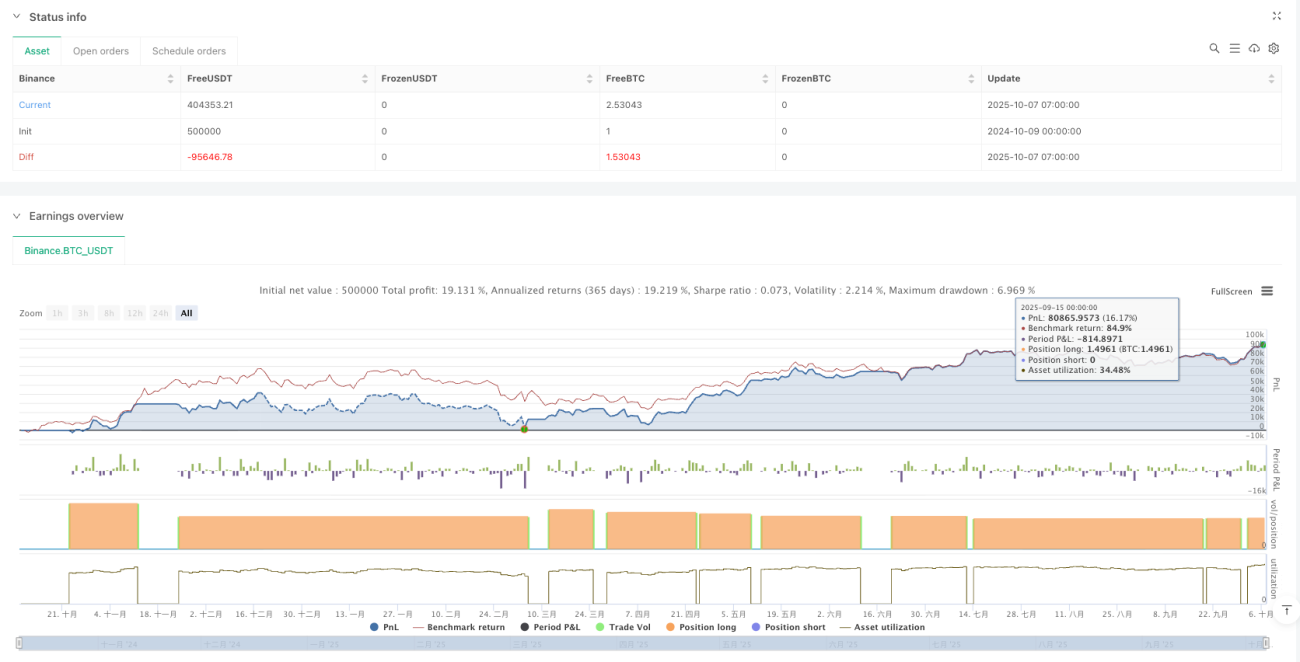
15분 BTC 백테스트 최적화, 그러나 시장 환경 주의
전략은 BTC 15분봉 백테스트에서 좋은 성과를 보였지만, 이것이 모든 시장 환경에서 유효하다는 의미는 아니다. 횡보 장세에서는 삼중 확인에도 불구하고 많은 가짜 신호가 발생할 수 있다. 이 전략은 명확한 추세 특성을 가진 시장 환경에 가장 적합하다.
위험 경고: 과거 백테스트는 미래 수익을 보장하지 않으며, 암호화폐 시장은 변동성이 매우 커 원금 손실 위험이 존재한다. 실전 투자 전에 충분한 모의 거래 검증과 전체 포지션에 대한 엄격한 리스크 관리를 권장한다.
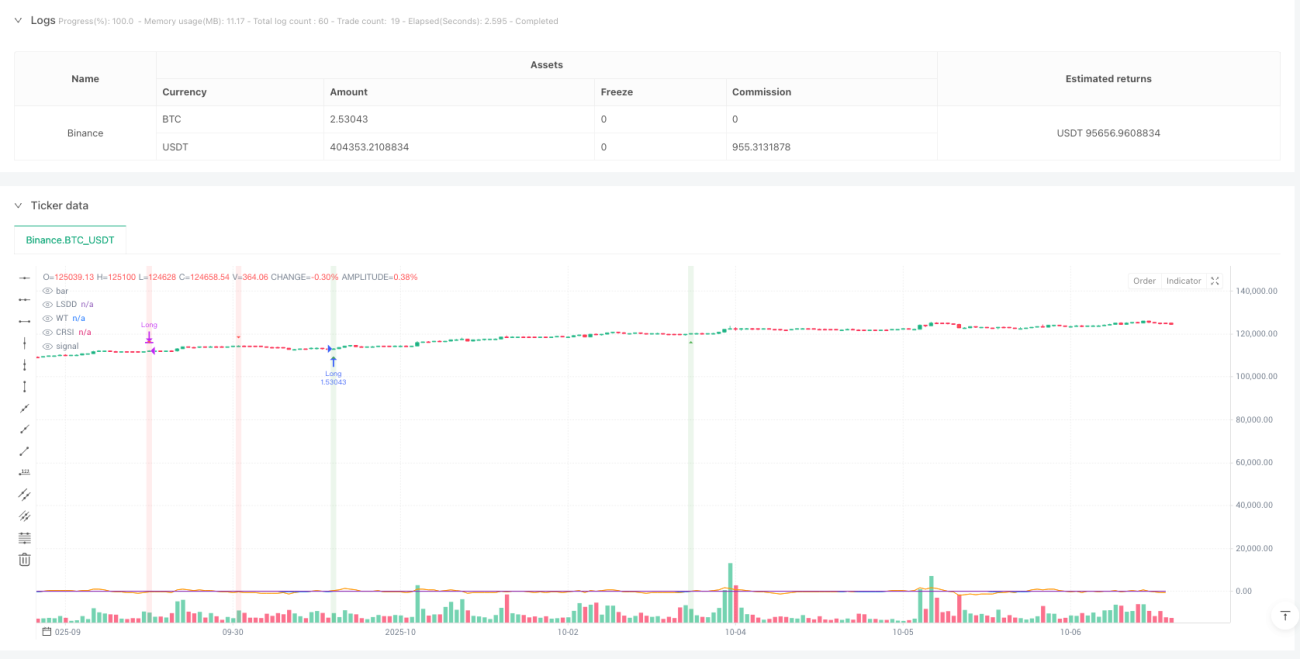
/*backtest
start: 2024-10-09 00:00:00
end: 2025-10-07 08:00:00
period: 1h
basePeriod: 1h
exchanges: [{"eid":"Binance","currency":"BTC_USDT","balance":500000}]
*/

//@version=5
// This source code is subject to the terms of the Mozilla Public License 2.0 at https://mozilla.org/MPL/2.0/
// © alescha13
// WT + CRSI + Linear Regression Long-only Strategy- 1