양극 평활 오실레이터 전략

🎯 이게 무슨 신박한 전략이야?
알고 계셨나요? 이 전략은 마치 시장에 '감정 탐지기'를 장착한 것과 같습니다! 📡 이 전략은 양극 평활 오실레이터를 통해 시장의 '기쁨과 슬픔'을 감지하여, 시장이 지나치게 흥분할 때(과매수) 또는 지나치게 낙담할 때(과매도) 거래 신호를 발생시킵니다. 중요 포인트! 이것은 일반 오실레이터가 아니라 '이중 미용' 처리된 고급 버전으로, 시장의 노이즈를 효과적으로 걸러내어 진정한 추세 방향을 파악할 수 있게 해줍니다.
💡 작동 원리 대공개
상상해보세요, 이 전략은 마치 초예민한 '시장 체온계'와 같습니다 🌡️. 먼저, 25주기 이동평균선으로부터 가격이 얼마나 벗어났는지 계산한 후, 이를 표준화 처리합니다(마치 키가 다른 사람들을 표준 키 비율로 환산하는 것과 같습니다). 다음으로 핵심적인 '이중 평활' 과정이 진행되는데, 마치 사진에 연속으로 두 번 미용 필터를 적용하는 것처럼 신호를 더욱 선명하고 신뢰할 수 있게 만듭니다. 오실레이터가 설정된 임계값을 돌파하면, 전략은 과감하게 행동에 나섭니다!
⚡ 이 전략의 초능력
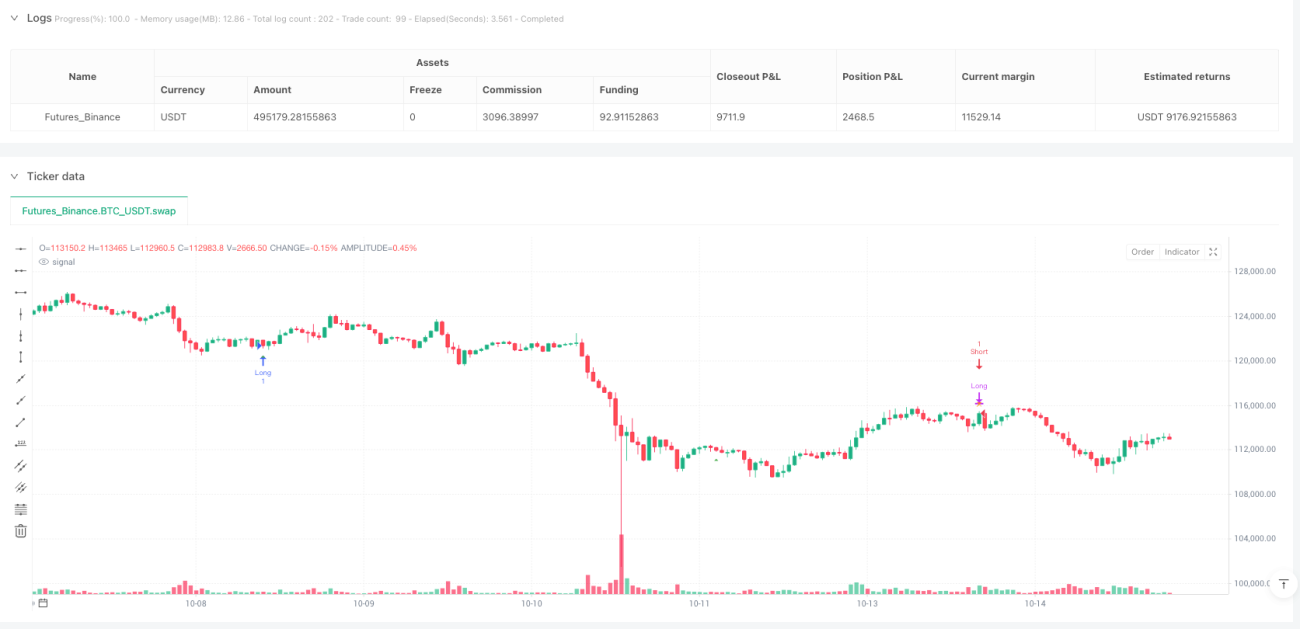
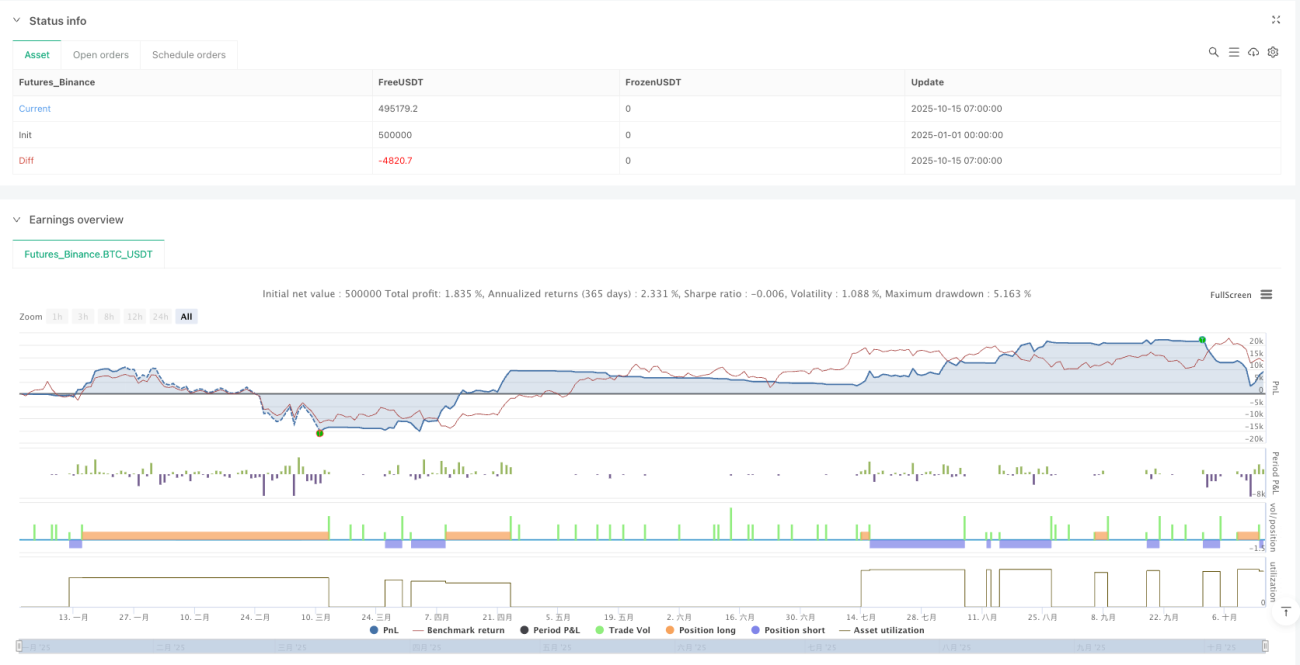
함정 회피 가이드 등장! 이 전략의 가장 뛰어난 점은 '역방향 신호 청산' 메커니즘입니다. 운전 중 빨간불을 보면 즉시 브레이크를 밟는 것처럼 똑똑합니다! 🚦 반대 신호가 나타나면, 전략은 즉시 포지션을 청산하며 끝까지 버티지 않습니다. 동시에 5주기 고정 손절매 보호 기능이 마치 자금에 '에어백'을 추가한 것처럼 작동합니다. 가장 세심한 점은 완전한 거래 통계 기능이 내장되어 있어, 언제든지 전략의 성과를 확인할 수 있다는 것입니다!
🚨 위험 알림은 빼놓을 수 없습니다
중요 포인트! 이 전략이 뛰어나긴 하지만 만능은 아닙니다. 강한 추세 시장에서는 오실레이터가 '길을 잃을' 수 있습니다. 마치 고속도로에서 시내 내비게이션을 사용하는 것처럼 적합하지 않을 수 있습니다. 고정된 임계값 설정은 다양한 시장 환경에서 잘 맞지 않을 수 있으므로, 실제 상황에 맞게 유연하게 조정해야 합니다. 명심하세요, 어떤 전략이든 적절한 리스크 관리와 함께 사용되어야 하며, 모든 달걀을 한 바구니에 담지 마세요!
- 1