밸런스 빔 트레이딩 방법: 캔들스틱과 이치모쿠 클라우드 차트가 만났을 때의 완벽한 춤

<unk>, 이 전략이 무슨 짓을 하고 있는 걸까요?
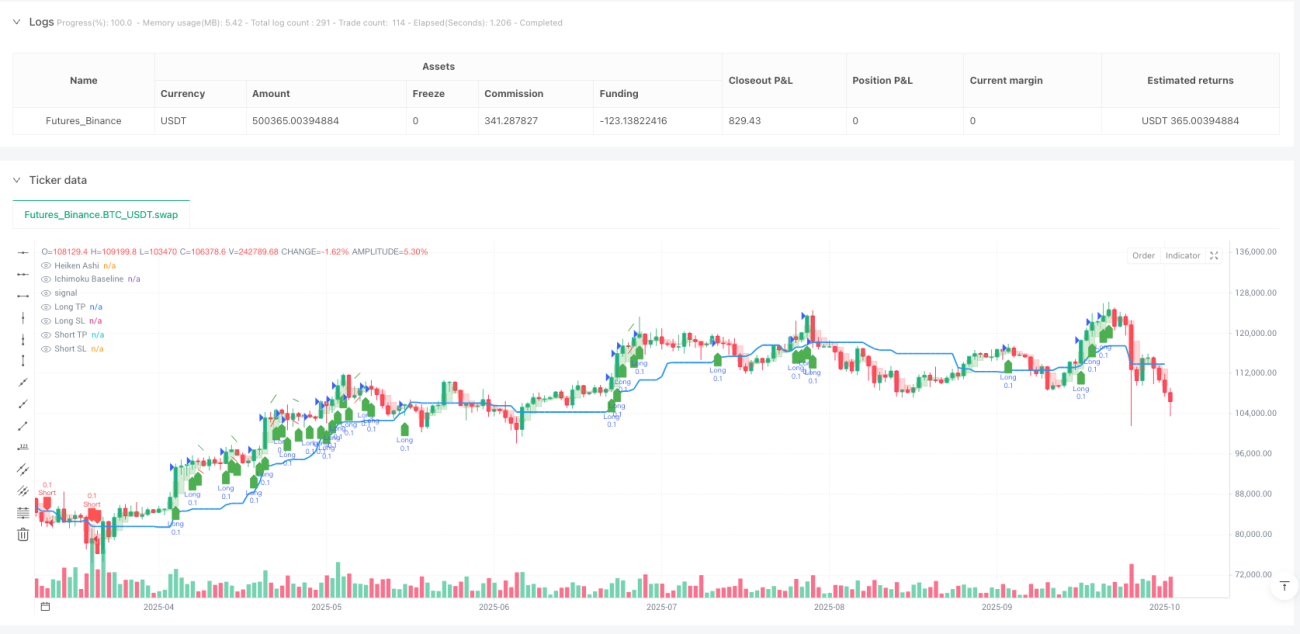
이 전략은 <unk>그램을 평형 나무 위에 춤추는 것과 같습니다. 이 전략은 일반적인 K그램을 더 부드러운 Heiken Ashi <unk>로 바꾸고, 이치모쿠 클라우드 <unk>의 기준선과 결합하여 기술 분석계의 "두 사람 스키"를 만듭니다.
🔍 핵심 논리: 삼중 필터의 지혜
이 전략의 핵심은 "트리플 필터 시스템"으로, 당신이 심도검사 대상을 선택하는 것처럼 엄격합니다. 첫째, 하이켄 아시<unk>은 이치모쿠 기준선의 올바른 쪽에 있어야 합니다 (이것은 기본 임계입니다); 둘째, 200주기 EMA는 당신이 큰 추세에 따라가는 것을 보장합니다 (류를 거슬러 올라가지 마십시오); 마지막으로, 이치모쿠는 필터로부터 뒤로 떨어져서 운동량 방향이 올바른 것을 보장합니다 (실조 돌파를 방지하는 구멍).
이것은 마치 운전하는 것과 같습니다. 녹색 신호가 켜져 있고, 도로 상태가 좋으며, 앞쪽에는 역행 차량이 없는 상태입니다.
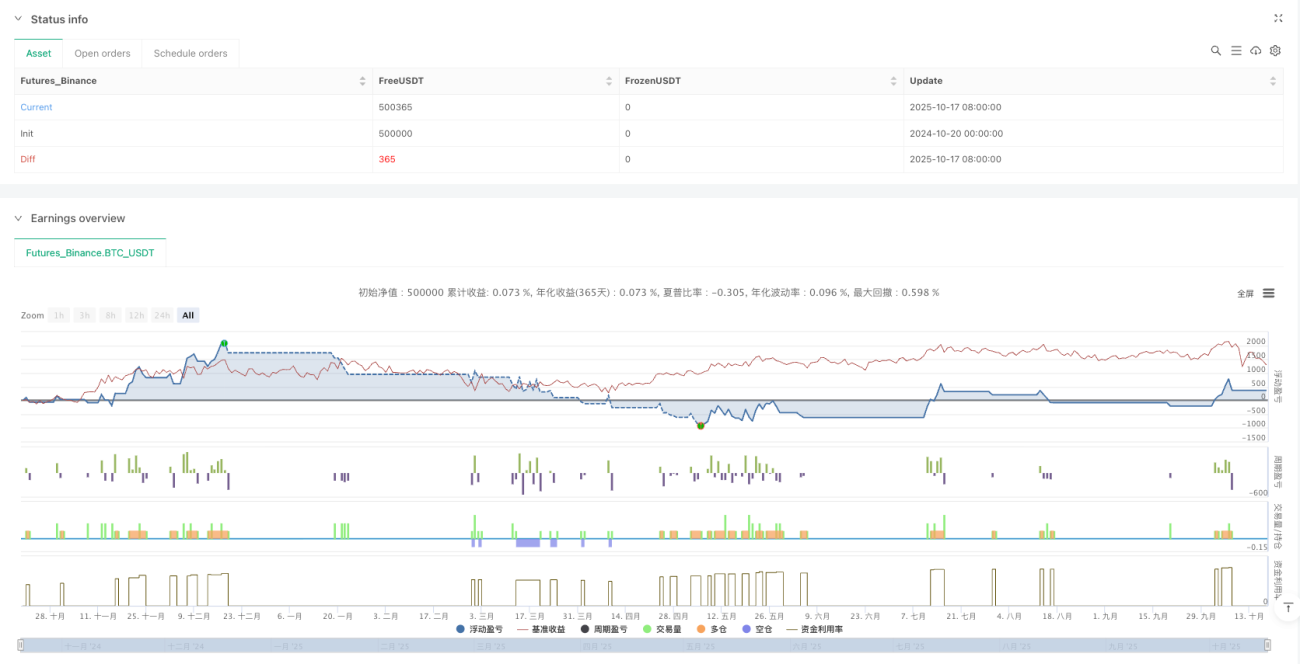
<unk> 위험 관리: ATR 동적 정지
도랑 피 가이드는 여기에 있습니다! 이 전략의 가장 똑똑한 부분은 ATR을 사용하여 스톱 스톱을 설정하는 것입니다. 그것은 자동차의 적응 항해 시스템과 마찬가지로 시장의 변동성에 따라 자동으로 조정됩니다. 시장의 변동성이 큰 경우 스톱 스톱 거리가 자동으로 넓어집니다.
더 놀라운 것은, 그것은 또한 여러 시간 프레임을 사용한다는 것입니다: 높은 시간 프레임의 ATR은 중지하기 위해 사용된다 (이윤을 충분히 실행), 낮은 시간 프레임의 ATR은 손실을 막기 위해 사용된다 (빠른 손실 보호).
실제 전투에 사용할 수 있는 <unk>: 언제 사용해야 할까요?
이 전략은 특히 트렌드가 뚜렷한 시장 환경에 적합합니다. 시장이 수평으로 흔들릴 때 잠시 지켜보는 것이 좋습니다. 왜냐하면 하이켄 아시는 흔들리는 시장에서 가짜 신호를 일으킬 수 있기 때문입니다.
어떤 전략도 만능이 아니라는 것을 기억하십시오. 이 전략의 강점은 중장기적 추세를 포착하는 것입니다. 만약 당신이 빠른 진출과 빠른 출퇴근의 짧은 라인 거래자를 좋아한다면, 당신은 파라미터를 조정하거나 다른 전략을 찾아야 할 수 있습니다.
/*backtest
start: 2024-10-20 00:00:00
end: 2025-10-18 08:00:00
period: 1d
basePeriod: 1d
exchanges: [{"eid":"Futures_Binance","currency":"BTC_USDT","balance":500000}]
*/

// This Pine Script® code is subject to the terms of the Mozilla Public License 2.0 at https://mozilla.org/MPL/2.0/
// © MahdiSalari8
//@version=6
strategy("Heiken Ashi Bas", overlay=true, - 1