
이것은 평범한 DCA 전략이 아니라, 스스로 생각하는 트레이딩 로봇입니다
수천 개의 Pine Script 코드를 살펴본 결과, 이 "Master Trading Bot"은 확실히 뛰어난 점이 있습니다. 저자는 DCA(정액분할투자)를 새로운 차원으로 끌어올렸습니다: 무작정 정액 투자가 아니라 기술적 지표에 기반한 지능형 추가 매수 시스템입니다. 초기 포지션 5%, DCA 때마다 2.5%씩 증가, 최대 100%를 초과하지 않습니다. 이러한 점진적 자금 관리 방식은 기존의 동일 금액 정기 투자보다 더 과학적입니다.
핵심은 DCA 발동 조건입니다: 가격이 평균 매입 단가를 하회해야 하며, 하락폭이 2% + 단계 × 4%의 동적 임계값에 도달해야 합니다. 첫 번째 DCA는 2% 하락이 필요하고, 두 번째는 6%, 세 번째는 10% 하락이 필요합니다. 이러한 설계는 작은 변동에서 잦은 추가 매수를 방지하고, 진정한 조정 시에만 포지션을 늘리도록 합니다.
다양한 기술 지표 조합, 하지만 논리는 명확하고 불필요함이 없음
전략은 3/7/18 기간 EMA로 추세 프레임을 구축하고, 20 기간 볼린저 밴드로 가격 위치를 판단합니다. MACD 파라미터는 52/200/3으로 중장기 신호에 치우쳐 있으며, 14 기간 RSI는 과매수/과매도 판단에 사용됩니다. 이 조합은 추세, 모멘텀, 변동성 세 가지 차원을 모두 커버하여 단일 지표 전략보다 더 신뢰할 수 있습니다.
매수 조건은 엄격합니다: 빠른 EMA > 느린 EMA + MACD 골든크로스 + 가격이 볼린저 중간선 위 + RSI < 65. 이 네 가지 조건이 동시에 충족되어야만 포지션을 열며, 대부분의 거짓 신호를 걸러냅니다. 매도 조건도 마찬가지로 엄격합니다: 최소 2%의 이익 + 추세 약화 + MACD 데드크로스. 이러한 "이익이 있을 때만 매도" 설계는 의미 없는 손절을 피합니다.
100% 손절 설정은 공격적으로 보이지만, 실제로는 합리적임
코드에서 100% 손절은 매우 과장되어 보이지만, 주석에 명확히 적혀 있습니다: "가격이 0까지 떨어져야 발동". 이는 사실상 전통적인 손절을 비활성화하고, 전적으로 기술적 지표와 이익 목표에 의존해 위험을 관리합니다. DCA 전략의 경우 이러한 설계는 합리적입니다 — 하락 중에 추가 매수하는 전략에서는 전통적인 손절이 의미를 잃기 때문입니다.
진정한 위험 통제는 다음에 있습니다: 2% 가격 하락 신호 + 동적 DCA 임계값 + 강제 이익 청산. 전략은 500 기간 내 최고가를 추적하며, 현재 가격이 최고점 대비 2% 이상 하락하면 매도 신호를 발생시킵니다. 이는 고정 손절보다 더 유연하며, 다양한 시장 환경에 적응할 수 있습니다.
자금 관리는 이 전략의 핵심 경쟁력
매수 금액 = 현재 자본 × DCA 백분율 ÷ 현재 가격. 고정 금액이 아닌 자본 비율 기반 설계로, 전략이 계좌 성장에 따라 포지션을 확대할 수 있습니다. 초기 5%의 포지션은 단일 리스크를 통제하고, 점진적 추가 매수는 진정한 기회 앞에서 충분한 화력을 보장합니다.
가장 정교한 부분은 "just_sold" 상태 관리입니다: 매도 직후 강한 상승 신호가 나타나지 않으면 즉시 재매수하지 않습니다. 이는 변동장에서의 잦은 거래를 방지하고, 수수료 비용과 감정적 거래의 위험을 낮춥니다.
적용 시나리오 명확, 만능 전략 아님
이 전략은 중장기 상승 추세에서의 조정 매수에 가장 적합하며, 약세장이나 장기 횡보장에서는 성과가 좋지 않습니다. MACD의 52/200 파라미터 설정은 더 큰 규모의 추세 판단에 적합하며, 단기 트레이딩에는 적합하지 않습니다.
RSI 과매도 임계값을 30이 아닌 25로 설정한 것은 전략이 더 깊은 조정에서 매수하는 쪽에 치우쳐 있음을 의미합니다. 이러한 설계는 강세장에서 더 좋은 매수 포인트를 제공하지만, 약세장에서는 "칼을 잡는" 꼴이 될 수 있습니다. 명확한 상승 추세에서 사용하고, 시장 고점이나 하락 추세에서 시작하는 것을 피하시기 바랍니다.
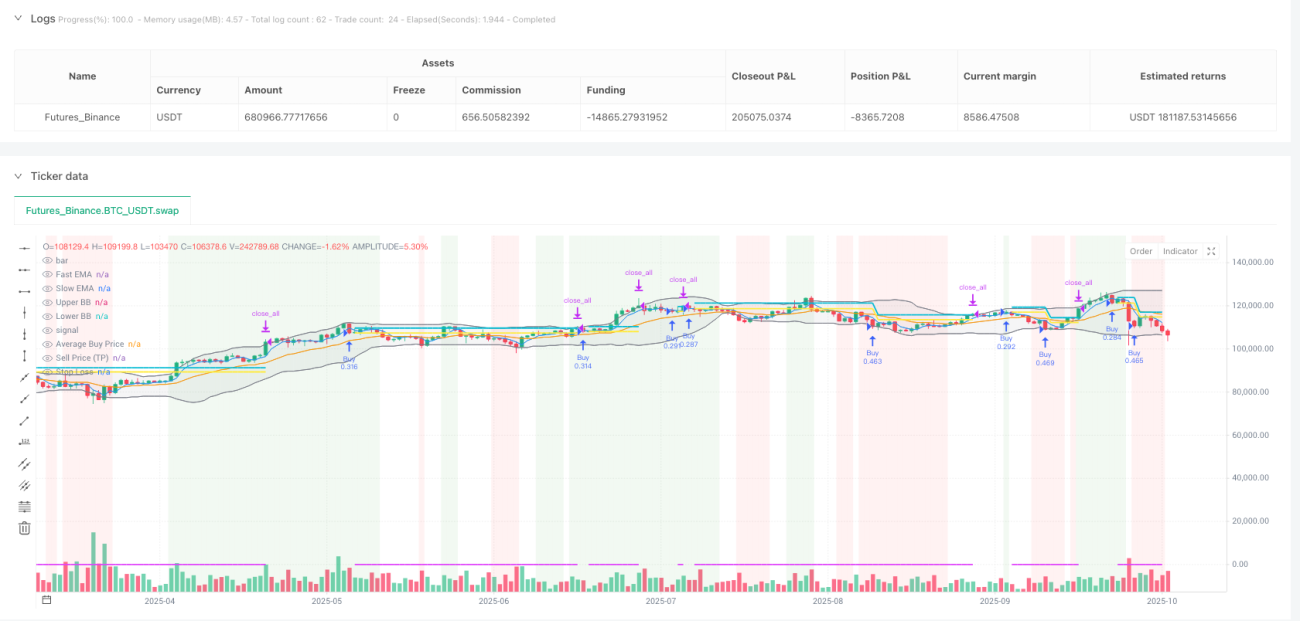
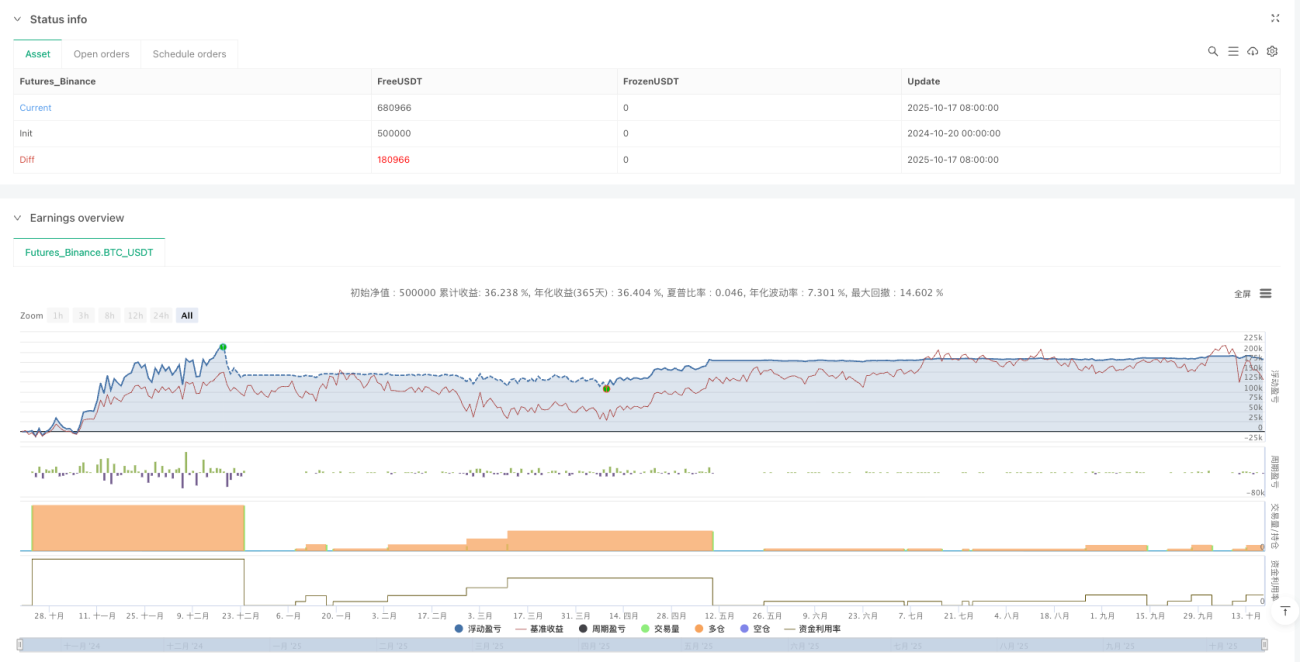
백테스트 성과: 최대 낙폭과 연속 손실에 주목해야 함
전략의 이론적 논리는 완벽하지만, 실제 성과는 구체적인 백테스트 데이터를 확인해야 합니다. 중점적으로 봐야 할 사항: 최대 낙폭이 허용 가능한 범위 내에 있는지, 연속 손실 횟수가 너무 많지 않은지, 다양한 시장 환경에서의 성과 차이.
DCA 전략의 특징은 하락 과정에서 지속적으로 포지션을 늘린다는 점입니다. 이는 계좌 자산이 먼저 하락한 후 상승한다는 것을 의미합니다. 투자자는 충분한 심리적 인내력과 자금 여유가 필요합니다. 먼저 소액으로 테스트한 후 전략의 특성을 확인한 다음 투자 규모를 점진적으로 확대하는 것을 권장합니다.
위험 고지: 모든 퀀트 전략은 손실 위험이 있으며, 과거 백테스트는 미래 수익을 보장하지 않습니다. 엄격한 위험 관리와 적절한 자금 배분이 필요합니다.
/*backtest
start: 2024-10-20 00:00:00
end: 2025-10-18 08:00:00
period: 1d
basePeriod: 1d
exchanges: [{"eid":"Futures_Binance","currency":"BTC_USDT","balance":500000}]
*/

// This Pine Script™ code is subject to the terms of the MPL 2.0 at https://mozilla.org/MPL/2.0/
// © MTB by Neurodoc
// By Nicolás Astorga
- 1