추세선 돌파 헌터

200일 EMA + 동적 추세선, 이 조합이 시장의痛点를 정확히 찌른다
더 이상 지연되는 전통적 지표를 사용하지 마세요. 이 전략은 200일 EMA로 큰 추세 방향을 판단한 후, 주요 저항/지지 구간에서 돌파 기회를 찾습니다. 핵심 로직은 간단하면서도 강력합니다: 강세장에서는 하락 추세선 돌파로 매수, 약세장에서는 상승 추세선 돌파로 매도합니다.
데이터가 말해줍니다: 전략은 5+5 피벗 포인트 탐지를 사용하여 신호가 다시 그려지지 않도록 보장합니다. 20기간 되돌아보기 창(window)은 과거 데이터 범위를 제한하여 과적합을 피합니다. 이것은 미신이 아닌 순수한 가격 행동 분석입니다.
1:3 위험-보상 비율 설계, 수학적 기대값이 당신 편에 있습니다
손절은 이전 캔들의 고가/저가에 설정되고, 이익 실현 목표는 손절 거리의 3배입니다. 즉, 승률이 30%에 불과하더라도 장기적으로 수익을 낼 수 있습니다.
구체적 실행: 매수 돌파 후, 손절 = 이전 저가, 이익 실현 = 진입가 + 3 × (진입가 - 이전 저가). 매도는 반대입니다. 리스크 관리는 기본적으로 계좌 자금의 1%로 설정되며, 0.1%~10% 범위에서 조정 가능합니다. 무턱대고 전액 투자하는 전략보다 100배 안전합니다.
피벗 포인트 탐지 메커니즘, 주관적 선 긋기 시대의 종말
전통적 기술 분석의 가장 큰 문제는 주관성이 너무 강하다는 것입니다. 이 전략은 알고리즘으로 주요 고점/저점을 자동으로 식별합니다:
- 왼쪽 5개 캔들 + 오른쪽 5개 캔들로 피벗 포인트 확인
- 20기간 내 가장 최근의 두 개 유효 피벗 포인트만 연결
- 강세장 편향: 감소하는 고점을 연결하여 하락 추세선 형성
- 약세장 편향: 증가하는 저점을 연결하여 상승 추세선 형성
결과? 완전히 객관적, 재도표화(zero repaint) 없음, 재현 가능합니다. 수동으로 선을 그리는 것보다 1000배 더 정확합니다.
이중 필터 메커니즘, 가짜 돌파 확률 대폭 감소
첫 번째 필터: EMA 추세 방향 판단. 가격이 200일 EMA 위에 있으면 매수 돌파만, 아래에 있으면 매도 돌파만 실행합니다. 이 한 가지 방법으로 역추세 거래의 80%를 직접 걸러냅니다.
두 번째 필터: 추세선 유효성 검증. 시스템은 두 개의 조건에 맞는 피벗 포인트를 찾아야만 추세선을 그립니다. 충분한 데이터가 뒷받침되지 않는 '추세선'은 무시됩니다.
실전 효과: 횡보장에서는 무효 신호를 크게 줄이고, 추세장에서는 돌파 기회를 정확하게 포착합니다.
동적 포지션 관리, 수익보다 리스크 통제가 더 중요
두 가지 포지션 모드 중 선택:
- 위험 비율 모드: 손절 거리에 따라 포지션 크기를 동적으로 조정하여 각 거래의 리스크를 고정
- 고정 계약 모드: 경험 많은 트레이더에게 적합, 포지션은 고정되지만 리스크는 손절 거리에 따라 변동
수학 공식: 포지션 크기 = (계좌 자금 × 위험 비율) ÷ 손절 거리
이 포지션 관리 시스템은 시중의 90% 전략보다 훨씬 과학적입니다. 연속 손실 시 자동으로 포지션을 줄이고, 수익 시 점진적으로 추가합니다.
전략의 한계, 숨기지 않겠습니다
이 전략은 만능이 아닙니다. 다음 상황에서는 성과가 좋지 않습니다:
- 횡보장: 잦은 가짜 돌파로 거래 비용 증가
- 극단적 변동성 장: 피벗 포인트 탐지가 급격한 변화에 뒤쳐질 수 있음
- 저유동성 종목: 가격 갭으로 인해 손절失效 가능
매개변수 민감도 주의:
- 피벗 포인트 민감도가 너무 낮으면 노이즈 신호 발생
- 되돌아보기 창(window)이 너무 짧으면 유효 추세선을 찾지 못할 수 있음
- 위험 비율이 2%를 초과하면 신중히 고려해야 함
실전 배포 제안, 이론이 아무리 좋아도 실행 가능해야
최적 적용 상황:
- 중장기 추세가 명확한 주요 종목
- 일봉 또는 4시간봉 차트
- 일정 변동성이 있지만 지나치게 과열되지 않은 시장 환경
매개변수 최적화 제안:
- 초보자는 위험을 0.5%~1%로 제어 권장
- 피벗 포인트 민감도는 종목 특성에 따라 조정
- 되돌아보기 창(window)은 시장 주기에 따라 적절히 연장 가능
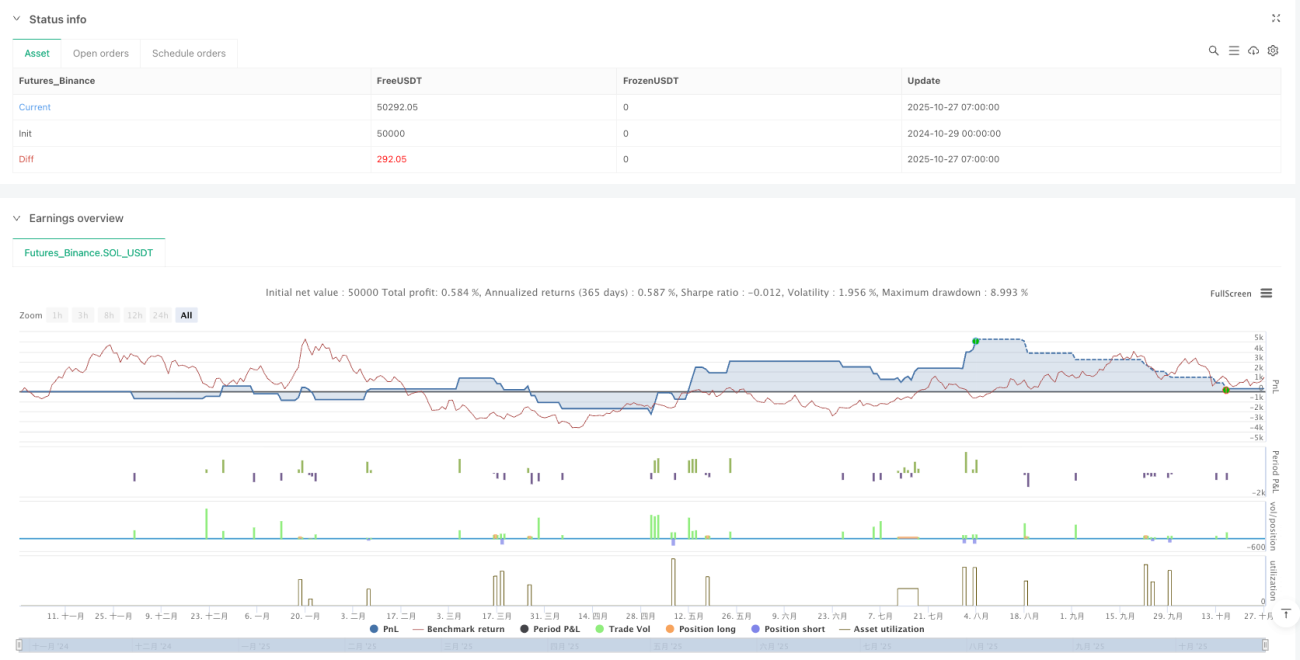
위험 고지: 과거 백테스트가 미래 수익을 보장하지 않으며, 모든 전략은 연속 손실 가능성이 있습니다. 모의 환경에서 먼저 테스트하고 전략 로직을 충분히 이해한 후 실전에 투입하시기 바랍니다. 시장에는 리스크가 따르며, 거래는 신중해야 합니다.
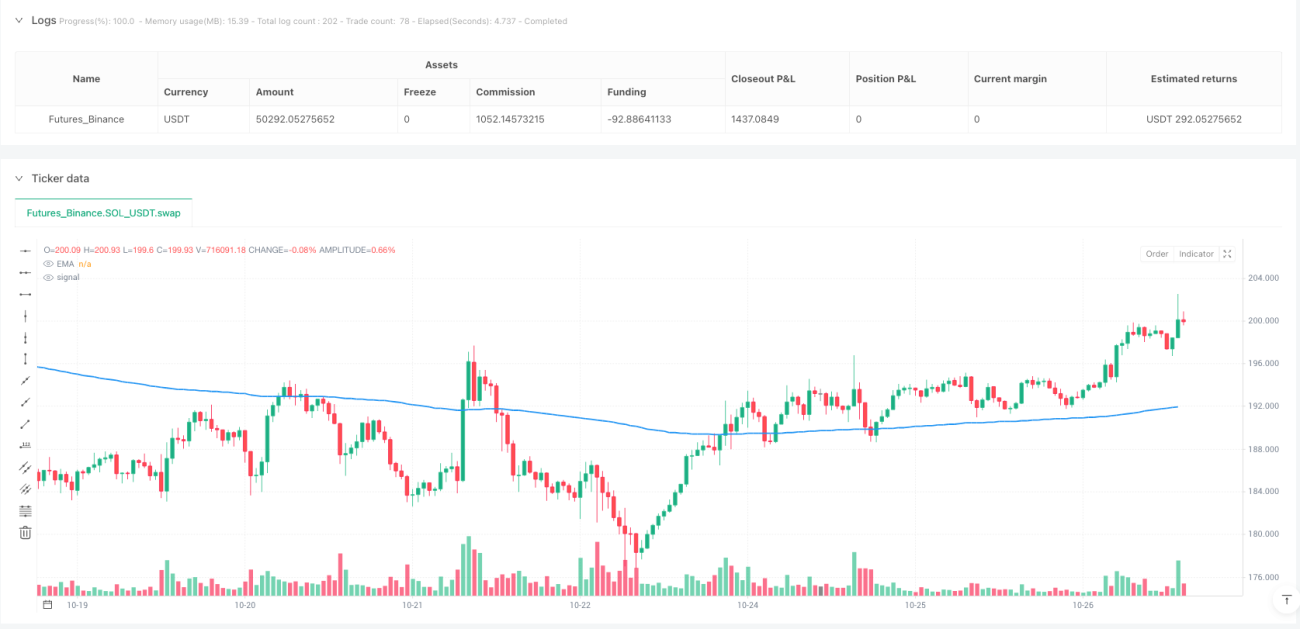
/*backtest
start: 2024-10-29 00:00:00
end: 2025-10-27 08:00:00
period: 1h
basePeriod: 1h
exchanges: [{"eid":"Futures_Binance","currency":"SOL_USDT"}]
*/

//@version=5
strategy("Trendline Breakout Strategy", overlay=true, max_lines_count=500, max_labels_count=500, max_boxes_count=500)

// === INPUTS ===- 1