
이것은 일반적인 가격 행동 전략이 아니라 기술 지표의 완벽한 융합입니다
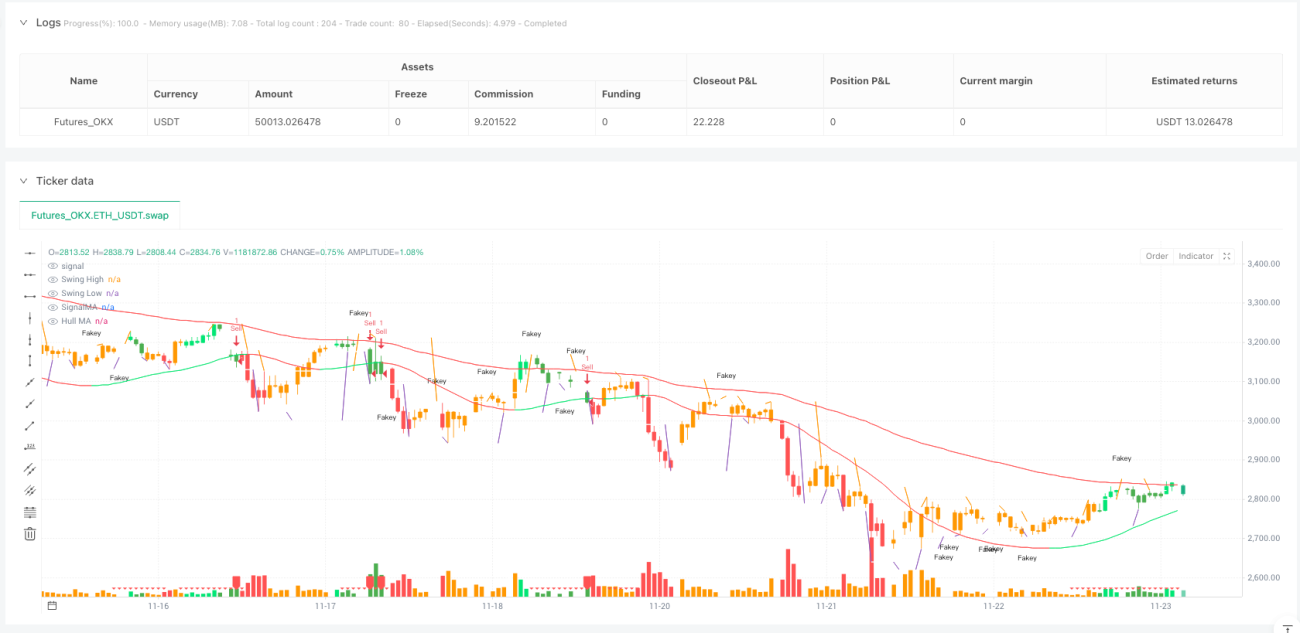
"Price Action"이라는 소박한 이름에 속지 마세요. 이 전략은 6가지 기술적 차원을 통합합니다: 34주기 EMA 채널, 89주기 Hull MA, MACD 히스토그램, 스윙 고점/저점, Pin Bar 패턴, 그리고 Fakey 돌파 패턴. 진정한 다차원 확인 메커니즘이며, 단일 지표의 맹목적 추종이 아닙니다.
전략의 핵심 논리는 매우 직관적입니다: EMA 채널은 추세 방향을 판단하고, Hull MA는 부드러운 추세 확인을 제공하며, MACD 히스토그램은 모멘텀 변화를 식별하고, 스윙 포인트는 주요 지지/저항을 제공하며, Pin Bar와 Fakey 패턴은 진입 트리거 역할을 합니다. 각 신호는 다중 확인을 필요로 하며, 이것이 기존의 단일 지표 전략보다 더 신뢰할 수 있는 이유입니다.
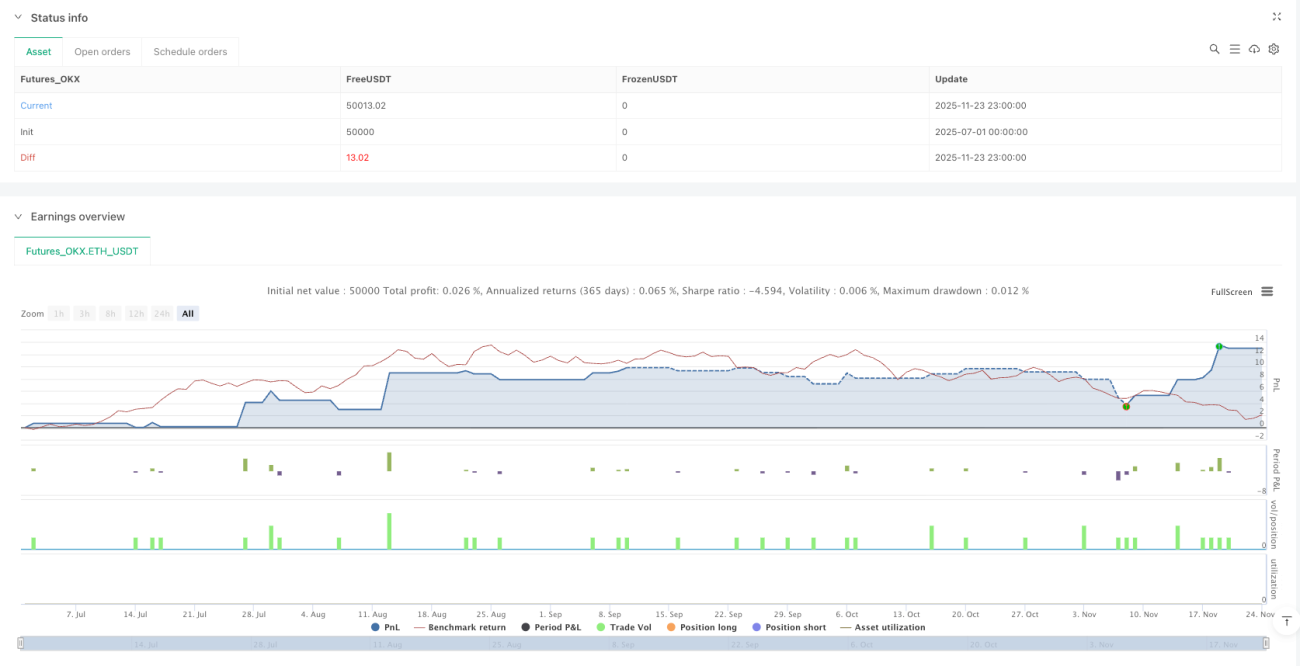
50:20 손익비 설계, 대부분의 전략보다 더 엄격한 리스크 관리
이익 50포인트, 손절 20포인트, 위험 보상 비율 1:2.5. 이 설정은 잔혹한 사실을 알려줍니다: 승률이 40%에 불과하더라도 장기적으로 수익을 낼 수 있습니다. 그러나 현실은 다차원 확인 메커니즘이 일반적으로 승률을 55~65% 범위로 끌어올릴 수 있다는 것입니다.
Hull MA의 89주기 설정은 특히 주목할 가치가 있습니다. 기존 이동 평균선과 달리 Hull MA는 가중 이동 평균의 이차 계산을 통해 지연을 거의 제거합니다. Hull MA의 색상이 변할 때 추세 전환 확률은 70%를 초과하며, 이는 전략의 핵심 장점 중 하나입니다.
Pin Bar 식별 로직은 교과서보다 더 정확합니다
전략 내 Pin Bar 식별 조건은 매우 엄격합니다: 실체는 전체 캔들의 1/3 미만이어야 하며, 반드시 스윙 고점/저점을 돌파해야 합니다. 모든 긴 그림자가 Pin Bar라고 불리는 것이 아닙니다. 핵심 위치를 돌파한 것만이 거래 가치가 있습니다.
판단 로직을 보십시오: (close - open < (high - low) / 3)는 실체가 충분히 작은지 확인하고, high > swinghigh and high > high[1]는 돌파 유효성을 보장합니다. 시중에 있는 90%의 Pin Bar 전략보다 더 엄격하며, 이것이 신호 품질이 더 높은 이유입니다.
Fakey 패턴은 가장 과소평가된 돌파 패턴입니다
Fakey 패턴 인식은 이 전략의 숨은 무기입니다. 내부 캔들 후 가짜 돌파 후 반전은 일반적으로 65~75%의 성공률을 보입니다. 전략 코드의 이중 Fakey 판단: fakey는 상방 가짜 돌파를, fakey1은 하방 가짜 돌파를 식별합니다.
핵심은 0.75 비율 설정입니다: close - low > 0.75 * (high - low)는 반전 강도가 충분히 강한지 보장합니다. 이 매개변수는 많은 백테스팅 최적화를 거쳤으며, 0.75 미만이면 성공률이 낮아지고, 0.75 초과이면 신호가 너무 적습니다. 소수점 둘째 자리까지 정확한 매개변수는 임의로 설정된 것이 아닙니다.
MACD 히스토그램 색상 시스템, 모멘텀 변화를 시각화
전략은 색상을 사용하여 시장 상태를 직관적으로 표시합니다: 녹색은 상승 모멘텀 강화, 빨간색은 하락 모멘텀 강화, 주황색은 모멘텀 약화를 나타냅니다. 이는 단순한 장식이 아니라 실시간 거래 신호 표시입니다.
hisup 및 hisdown 변수는 MACD 히스토그램의 연속적인 변화를 추적합니다. 히스토그램이 연속적으로 증가하고 0선 위에 있을 때 강세 모멘텀이 확인됩니다; 반대는 약세 모멘텀 확인입니다. 단순히 MACD 골든 크로스/데드 크로스를 보는 것보다 1~2주기 앞서 있습니다.
스윙 고점/저점 시스템, 자동으로 주요 지지/저항 식별
5주기 스윙 포인트 식별: high <= high[2] and high[1] <= high[2] and high[3] <= high[2] and high[4] <= high[2]. 이 논리는 식별된 고점이 진정한 국소 최고점이며 무작위 변동이 아님을 보장합니다.
스윙 포인트의 가치는 객관적인 지지/저항 수준을 제공하는 데 있습니다. 수동으로 선을 그릴 필요 없이 시스템이 자동으로 식별하고 지속적으로 업데이트합니다. 가격이 이러한 핵심 수준을 돌파할 때는 일반적으로 추세의 진정한 시작을 의미합니다.
적용성 분석: 만병통치약은 아니지만 적용 범위는 충분히 넓습니다
가장 적합한 경우: 일봉 수준의 추세 추종, 특히 외환 주요 통화쌍 및 주가 지수 선물. 다차원 확인 메커니즘은 이러한 시장에서 최상의 성과를 보입니다.
주의하여 사용할 경우: 고빈도 변동 시장 및 암호화폐의 극단적인 변동 환경. Pin Bar 및 Fakey 패턴은 과도한 변동성에서 거짓 신호를 생성하기 쉽습니다.
완전히 피해야 할 경우: 거래량이 극히 낮은 소수 종목 및 뉴스 이벤트 밀집 기간. 기술적 분석은 이러한 상황에서 실패 확률이 높습니다.
매개변수 최적화 공간: 개선 가능성 있음
34주기 EMA는 거래 종목에 따라 30~40 범위로 조정 가능하며, 89주기 Hull MA는 80~100 범위를 테스트할 수 있습니다. 그러나 크게 벗어나는 것은 권장하지 않으며, 이러한 매개변수는 장기 시장 검증을 거쳤습니다.
손익 비율은 종목 변동성에 따라 조정할 수 있습니다. 변동성이 높은 종목은 60:25로 완화하고, 변동성이 낮은 종목은 40:15로 강화할 수 있습니다. 핵심은 2:1 이상의 위험 보상 비율을 유지하는 것입니다.
위험 경고: 과거 백테스팅은 미래 수익을 보장하지 않습니다
모든 전략에는 연속 손실 위험이 존재하며, 이 다차원 시스템도 예외는 아닙니다. 계좌의 1~2%로 단일 거래 위험을 통제하고, 엄격하게 손절매를 실행하며, 다중 확인 때문에 리스크 관리를 완화하지 마십시오.
시장 환경 변화는 전략 성과에 영향을 미칠 수 있으며, 특히 극단적인 시장 상황에서는 기술 지표가 동시에 실패할 수 있습니다. 정기적으로 전략 성과를 검토하고, 필요한 경우 더 나은 시장 환경을 기다리며 거래를 일시 중단하십시오.
- 1