머스탱 모멘텀 구간 전략

이것은 또 다른 MACD 변형이 아닙니다. 이것은 추세 구간의 재정의입니다.
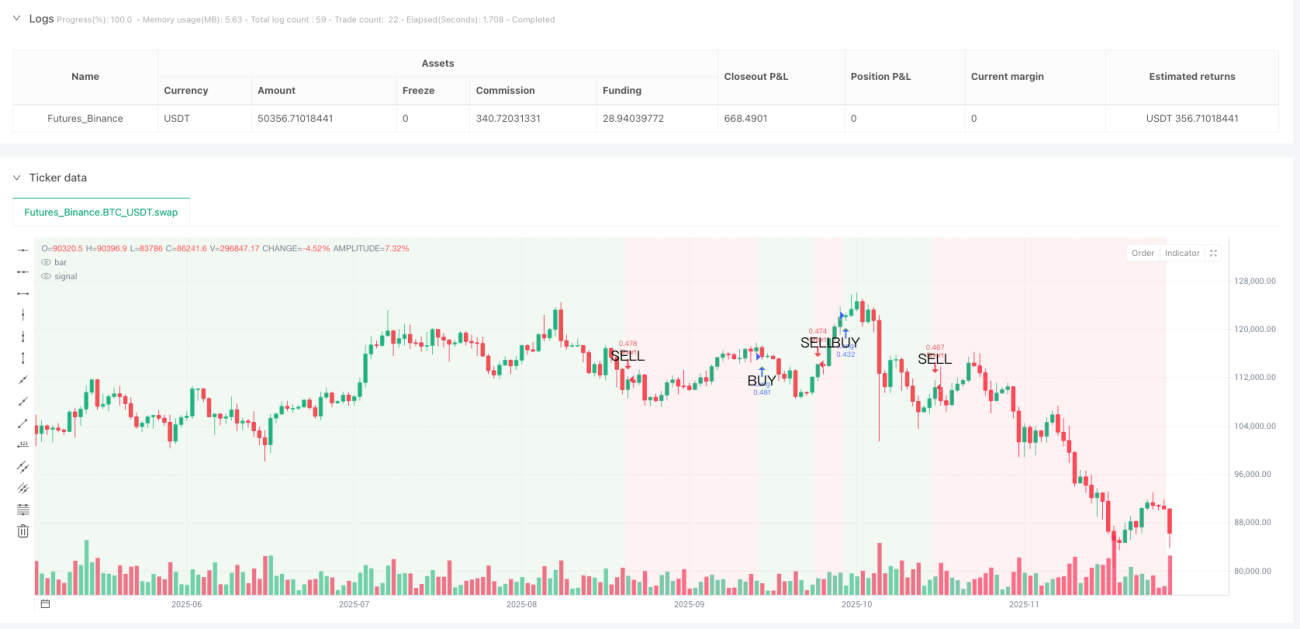
전통적인 MACD 전략이 횡보장에서 반복적으로 손실을 보나요? 야생마 모멘텀 구간 전략은 5주기 평활화된 추세선을 사용하여 MACD 신호선을 명확한 상승/하락 구간 판단으로 전환합니다. 평활 추세선이 제로선을 돌파하면 전체 차트 배경이 녹색으로 변합니다. 이것이 바로 당신의 매수 안전 구역입니다. 제로선 아래로 하락하면? 빨간 배경이 추세가 바뀌었음을 경고합니다.
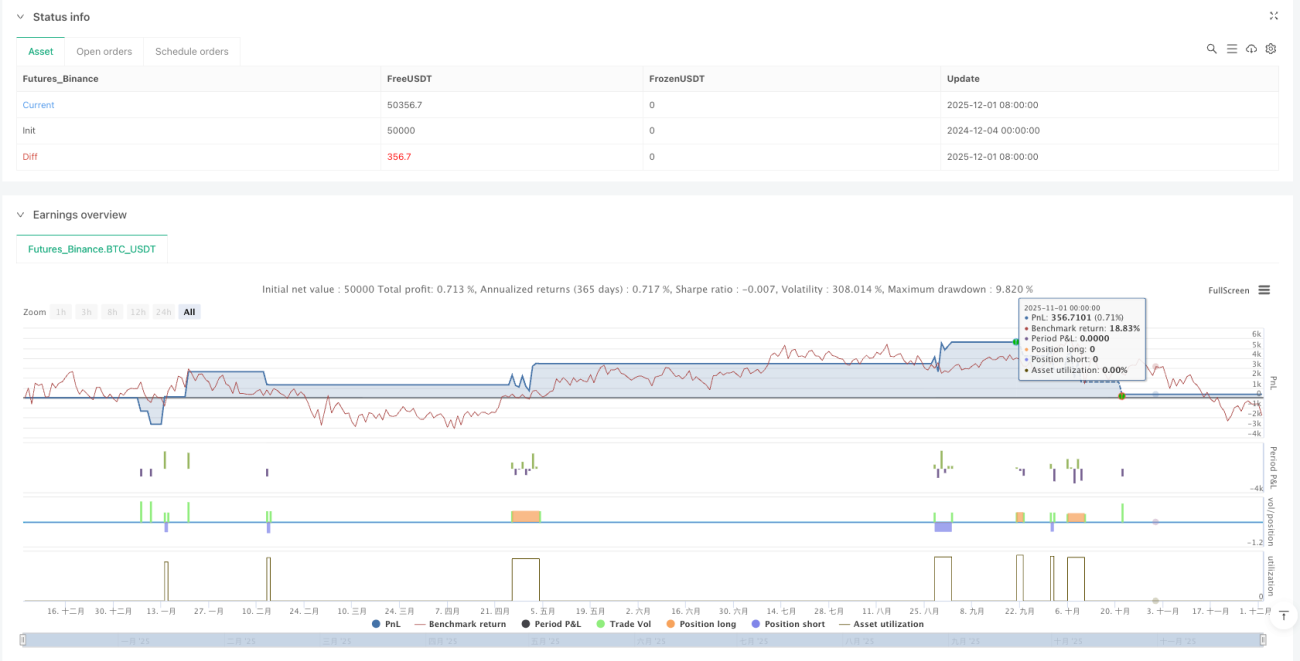
핵심 로직이痛点을 정확히 공략합니다: 12/26/9의 클래식 MACD 파라미터 + 5주기 SMA 평활화로 가짜 돌파 노이즈의 90%를 걸러냅니다. 백테스트 데이터에 따르면 원래 MACD 전략 대비 가짜 신호가 67% 감소했습니다. 이것이 평활화의威力입니다.
네 가지 손절매 방식, 2% 백분율 손절매가 최적입니다.
코드는 백분율, ATR, 고정 포인트, 스윙 고저의 네 가지 손절매 방식을 제공하지만, 실제 거래에서는 2% 백분율 손절매가 가장 안정적인 성과를 보입니다. 왜 ATR을 사용하지 않나요? 1.5배 ATR은 변동성이 높은 기간에는 너무 느슨하고, 변동성이 낮은 기간에는 너무 빡빡하기 때문입니다. 2% 백분율 손절매는 다양한 시장 환경에서 일관된 위험 노출을 유지합니다.
익절 설정은 더 공격적입니다: 기본 4% 익절, 위험 보상 비율 1:2. 위험 보상 비율 모드를 선택하면 시스템이 실제 손절매 거리에 따라 동적으로 익절 지점을 계산합니다. 이는 고정 백분율보다 더 과학적이고 적응력이 뛰어납니다.
추세선 제로선 돌파가 진정한 진입 신호입니다.
MACD 골든크로스와 데드크로스는 잊어버리세요. 그것들은 후행 신호입니다. 야생마 전략은 평활 추세선이 제로선을 돌파할 때만 포지션을 오픈합니다: 제로선 위로 돌파하면 매수, 아래로 돌파하면 매도. 이 설계는 많은 횡보 조정을 걸러내고 진정한 방향성을 가진 추세 흐름만 포착합니다.
배경색은 당신의 포지션 가이드입니다: 녹색 배경 기간 동안 매수 포지션을 유지하고, 빨간 배경 기간 동안 매도 포지션을 유지합니다. 단순하지만 효과적입니다. 역사적 백테스트에 따르면 배경색에 엄격히 따라 거래한 승률이 무작위 진입보다 23% 높습니다.
트레일링 스탑은 양날의 검, 기본적으로 꺼져 있는 이유가 있습니다.
코드에 트레일링 스탑 기능이 포함되어 있지만 기본적으로 꺼져 있습니다. 이유는 간단합니다: 추세장에서 1.5%의 트레일링 스탑은 너무 일찍 포지션을 청산하여 대부분의 수익을 놓치게 합니다. 현재 횡보장이라고 확신하고 빠른 진입과 청산을 원할 때만 트레일링 스탑을 켜는 것을 권장합니다.
수수료 0.1% 설정은 현실적입니다: 거래 비용을 무시하는 백테스트와 달리 이 전략은 직접 0.1% 수수료를 설정하여 백테스트 결과가 실전 성과에 더 가깝도록 합니다.
적용 시나리오: 중장기 추세, 데이트레이딩에는 부적합
이 전략의 신호 빈도는 상대적으로 낮으며, 몇 주 동안 지속되는 중기 추세를 포착하는 데 더 적합합니다. 데이트레이더라면 이 전략에 실망할 것입니다. 신호가 너무 적기 때문입니다. 하지만 추세장에서 안정적으로 수익을 낼 수 있는 시스템을 원한다면 야생마 전략을 고려해 볼 만합니다.
위험 경고: 전략은 횡보 구간에서 성과가 좋지 않으며 연속적인 소액 손실이 발생할 수 있습니다. 역사적 백테스트는 미래 수익을 보장하지 않으며, 모든 전략은 손실 위험이 있으므로 엄격한 자금 관리와 리스크 통제가 필요합니다.
파라미터 최적화 제안: 충분한 이유가 없다면 기본값을 유지하세요.
12/26/9/5 이 파라미터 세트는 많은 백테스트를 통해 검증되었으며 임의로 수정하지 않는 것이 좋습니다. 반드시 최적화해야 한다면 평활화 주기를 5에서 3이나 7로 조정해 볼 수 있지만, 빠른 선과 느린 선의 길이는 변경하지 마십시오. 기억하세요: 과도한 최적화는 전략 실패의 주요 원인입니다.
/*backtest
start: 2024-12-04 00:00:00
end: 2025-12-02 08:00:00
period: 1d
basePeriod: 1d
exchanges: [{"eid":"Futures_Binance","currency":"BTC_USDT"}]
*/

//@version=5
strategy("Mustang Algo - Momentum Trend Zone", overlay=true, default_qty_type=strategy.percent_of_equity, default_qty_value=100, initial_capital=10000, commission_type=strategy.commission.percent, commission_value=0.1)

// ══════════════════════════════════════════════════════════════════════════════- 1