
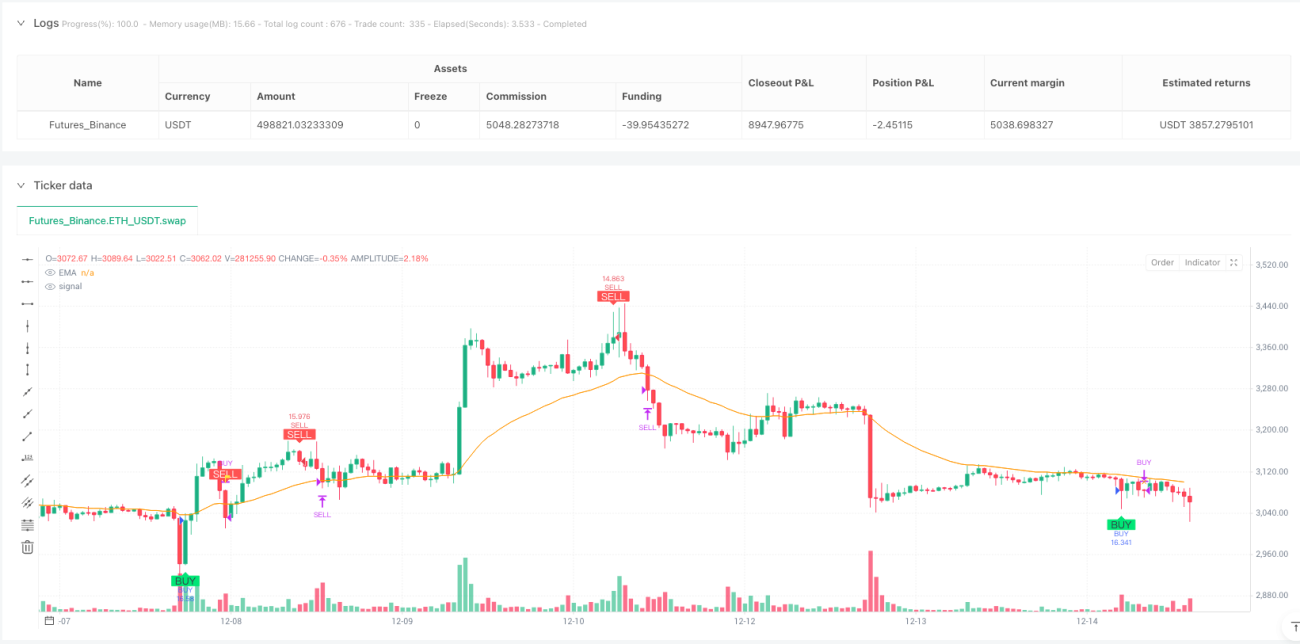
단일 지표에 더 이상 미신하지 마십시오. 이 전략은 유동성 청소, 거래량 이상, EMA 트렌드의 3 차원을 완벽하게 결합합니다. 11 주기의 흔들림은 중요한 지원 저항을 식별하고, 31 주기의 EMA 필터링 트렌드 방향입니다.
일반적인 유동성 청소 전략의 가장 큰 문제는 너무 많은 소음이다. 11주기 트랜지스 평균선의 1배를 필터로 사용하여, 전량 돌파구가 신호를 유발할 뿐이다. 데이터 증명, 트랜지스 확인을 추가하면, 승률이 15-20% 향상되지만, 일부 경량급의 효과적인 돌파구를 놓치게 된다. 그래서 이것은 선택적인 문제이며, 완벽한 해결책이 아니다.
가장 날카로운 디자인은 여기 있습니다: 반전 유동성 청소 신호가 발생하면 즉시 청산하십시오. 이러한 “적대자 나 후퇴”의 논리는 전통적인 정지보다 더 민감하며, 트렌드 반전의 초기에 철수 할 수 있습니다. 3 주기의 후의 가격 회수 및 평정 포지션 메커니즘과 협력하여 쌍방의 보호를 형성합니다. 그러나 너무 민감하면 빈번한 정지가 발생할 수 있습니다.
31주기 EMA는 진입 필터뿐만 아니라 강제 퇴출의 마지막 방어선입니다. 가격이 EMA를 넘어지면 무조건 평준화가 이루어집니다. 이 디자인은 “트렌드가 왕”이라는 핵심 정신을 나타냅니다. 역사적으로 볼 때,이 메커니즘은 큰 회수를 효과적으로 피할 수 있지만, 충격적인 상황에서 자주 유발됩니다.
코드에서 buy_lock 및 sell_lock 디자인은 매우 영리하다. 掃蕩 신호가 발동되면, 가격이 다시 핵심 위치로 돌아가는 때까지 동방향 신호를 잠금한다. 이것은 동일한 파동의 시장 상황에서 반복적으로 포지션을 열기를 피하고, 거래 비용과 위험 노출을 감소시킨다. 그러나 연속적인 돌파의 기회를 놓칠 수도 있다.
이 전략은 명확한 추세이지만 변동성이 큰 시장 환경에 가장 적합하다. 일방적인 상승 또는 하락에서 우수한 성능을 발휘하지만 가로판 흔들림에서 자주 손실이 발생합니다. 일선 수준에서 사용하는 것이 권장되며, 분 수준은 너무 큰 소음이다. 또한 유동성이 낮은 품종이 잘못된 신호를 일으킬 수 있다는 점에 유의하십시오.
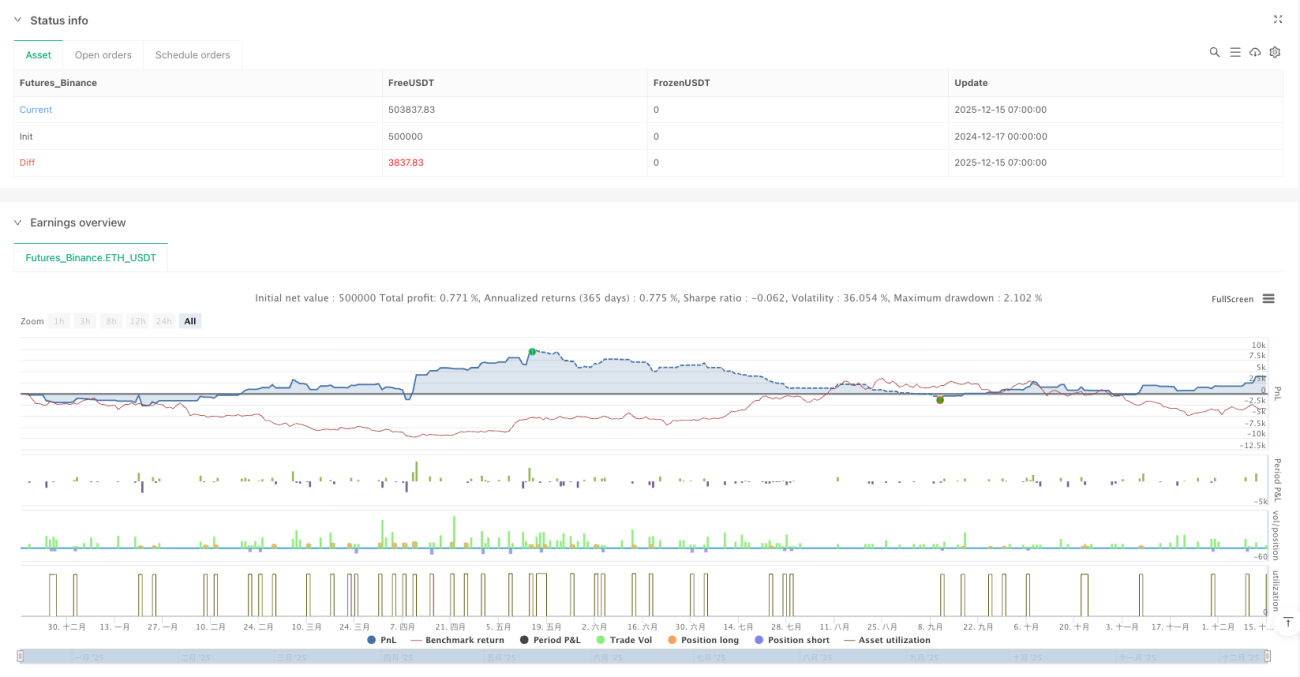
전략에는 연속적인 손실의 위험이 존재하며, 특히 시장 구조가 변화할 때 11 주기의 흔들림 식별은 일부 극단적 인 상황 하에서 실패 할 수 있으며, 31 주기의 EMA는 빠른 반전에서 뒤처져 있습니다. 단일 포지션이 총 자본의 10%를 초과하지 않도록 엄격하게 통제하고 시장 환경에 따라 파라미터를 조정하는 것이 좋습니다.
/*backtest
start: 2024-12-17 00:00:00
end: 2025-12-15 08:00:00
period: 1h
basePeriod: 1h
exchanges: [{"eid":"Futures_Binance","currency":"ETH_USDT","balance":500000}]
*/
//@version=5
strategy(
"Liquidity Sweep + Volume + OB + EMA Cross Exit (Fixed)",
overlay=true,
max_boxes_count=500,
max_lines_count=500,
initial_capital=100000,
default_qty_type=strategy.percent_of_equity,
default_qty_value=10,
pyramiding=1)
//━━━━━━━━━━━━━━━━━━━━━━━━━━━━━━━━━━
// INPUTS
//━━━━━━━━━━━━━━━━━━━━━━━━━━━━━━━━━━
len = input.int(11, "Swing Length", minval=1)
volLen = input.int(11, "Volume MA Length", group="Volume Filter")
volMult = input.float(1, "Volume Multiplier", step=0.1, group="Volume Filter")
emaLength = input.int(31, "EMA Length", minval=1, group="EMA Filter")
extendBoxes = input.bool(true, "Extend Boxes")
//━━━━━━━━━━━━━━━━━━━━━━━━━━━━━━━━━━
// EMA
//━━━━━━━━━━━━━━━━━━━━━━━━━━━━━━━━━━
emaVal = ta.ema(close, emaLength)
plot(emaVal, title="EMA", color=color.orange)
//━━━━━━━━━━━━━━━━━━━━━━━━━━━━━━━━━━
// COLORS
//━━━━━━━━━━━━━━━━━━━━━━━━━━━━━━━━━━
buyCol = color.lime
sellCol = color.red
liqBuyCol = color.new(color.lime, 85)
liqSellCol = color.new(color.red, 85)
obBuyCol = color.new(color.green, 75)
obSellCol = color.new(color.maroon, 75)
//━━━━━━━━━━━━━━━━━━━━━━━━━━━━━━━━━━
// VOLUME FILTER
//━━━━━━━━━━━━━━━━━━━━━━━━━━━━━━━━━━
volMA = ta.sma(volume, volLen)
highVol = volume > volMA * volMult
//━━━━━━━━━━━━━━━━━━━━━━━━━━━━━━━━━━
// PIVOTS
//━━━━━━━━━━━━━━━━━━━━━━━━━━━━━━━━━━
ph = ta.pivothigh(len, len)
pl = ta.pivotlow(len, len)
var float lastPH = na
var float lastPL = na
if not na(ph)
lastPH := ph
if not na(pl)
lastPL := pl
//━━━━━━━━━━━━━━━━━━━━━━━━━━━━━━━━━━
// LIQUIDITY SWEEPS
//━━━━━━━━━━━━━━━━━━━━━━━━━━━━━━━━━━
sellSweep = not na(lastPH) and high > lastPH and close < lastPH and highVol
buySweep = not na(lastPL) and low < lastPL and close > lastPL and highVol
//━━━━━━━━━━━━━━━━━━━━━━━━━━━━━━━━━━
// ANTI-SPAM LOCK
//━━━━━━━━━━━━━━━━━━━━━━━━━━━━━━━━━━
var bool buyLock = false
var bool sellLock = false
if buySweep
buyLock := true
else if not na(lastPL) and close < lastPL
buyLock := false
if sellSweep
sellLock := true
else if not na(lastPH) and close > lastPH
sellLock := false
buySignal = buySweep and not buyLock[1]
sellSignal = sellSweep and not sellLock[1]
//━━━━━━━━━━━━━━━━━━━━━━━━━━━━━━━━━━
// TRADE STATE
//━━━━━━━━━━━━━━━━━━━━━━━━━━━━━━━━━━
var float entryPrice = na
var int entryBar = na
var int entryDir = 0 // 1 = BUY, -1 = SELL
var bool tradeAlive = false
//━━━━━━━━ ENTRY ━━━━━━━━━━━━━━━━━━━
if buySignal and not tradeAlive
strategy.entry("BUY", strategy.long)
entryPrice := close
entryBar := bar_index
entryDir := 1
tradeAlive := true
if sellSignal and not tradeAlive
strategy.entry("SELL", strategy.short)
entryPrice := close
entryBar := bar_index
entryDir := -1
tradeAlive := true
barsFromEntry = tradeAlive ? bar_index - entryBar : na
//━━━━━━━━━━━━━━━━━━━━━━━━━━━━━━━━━━
// EXIT LOGIC
//━━━━━━━━━━━━━━━━━━━━━━━━━━━━━━━━━━
exitBuyAfter3 = tradeAlive and entryDir == 1 and barsFromEntry >= 3 and close < entryPrice
exitSellAfter3 = tradeAlive and entryDir == -1 and barsFromEntry >= 3 and close > entryPrice
exitOppBuy = tradeAlive and entryDir == 1 and sellSignal
exitOppSell = tradeAlive and entryDir == -1 and buySignal
// EMA downside cross exit
emaCrossDown = tradeAlive and ta.crossunder(close, emaVal)
exitEMA = emaCrossDown
exitSignal = exitBuyAfter3 or exitSellAfter3 or exitOppBuy or exitOppSell or exitEMA
if exitSignal
if entryDir == 1
strategy.close("BUY")
if entryDir == -1
strategy.close("SELL")
tradeAlive := false
entryPrice := na
entryBar := na
entryDir := 0
//━━━━━━━━━━━━━━━━━━━━━━━━━━━━━━━━━━
// PLOTS
//━━━━━━━━━━━━━━━━━━━━━━━━━━━━━━━━━━
plotshape(buySignal, "BUY", shape.labelup, location.belowbar, color=buyCol, text="BUY", textcolor=color.black)
plotshape(sellSignal, "SELL", shape.labeldown, location.abovebar, color=sellCol, text="SELL", textcolor=color.white)
plotshape(exitBuyAfter3, "EXIT BUY 3+", shape.xcross, location.abovebar, color=color.orange)
plotshape(exitSellAfter3, "EXIT SELL 3+", shape.xcross, location.belowbar, color=color.orange)
plotshape(exitOppBuy, "EXIT BUY OPP", shape.flag, location.abovebar, color=color.yellow)
plotshape(exitOppSell, "EXIT SELL OPP", shape.flag, location.belowbar, color=color.yellow)
plotshape(exitEMA and entryDir == 1, "EXIT EMA BUY", shape.triangledown, location.abovebar, color=color.blue)
plotshape(exitEMA and entryDir == -1, "EXIT EMA SELL", shape.triangleup, location.belowbar, color=color.blue)
//━━━━━━━━━━━━━━━━━━━━━━━━━━━━━━━━━━
// ALERTS
//━━━━━━━━━━━━━━━━━━━━━━━━━━━━━━━━━━
alertcondition(buySignal, "BUY Alert", "Liquidity Sweep BUY")
alertcondition(sellSignal, "SELL Alert", "Liquidity Sweep SELL")
alertcondition(exitEMA,title="EXIT EMA CROSS",message="Price crossed below EMA")