
Gunakan fungsi KlineChart untuk memudahkan reka bentuk lukisan strategi
Apabila mereka bentuk strategi, selalunya perlu mereka bentuk paparan carta strategi apabila menggunakan JavaScript atau Python untuk menulis strategi. Pengguna yang tidak biasa dengan pengaturcaraan atau perpustakaan carta yang digunakan oleh platform FMZ sering bergelut dengan reka bentuk kod untuk melukis pada carta tersuai. Jadi bagaimana kita boleh melukis carta strategi dengan kandungan yang kaya dengan menulis hanya sejumlah kecil kod?
Kaedah lukisan yang ringkas tetapi berkuasa ini boleh dilihat dalam bahasa Pine, yang terkenal dengan fungsi lukisan yang kaya. Jika antara muka lukisan bahasa Pine boleh disambungkan kepada strategi bahasa JavaScript dan Python, ia akan memudahkan pembangun untuk mereka bentuk fungsi lukisan strategi tersebut. Berdasarkan permintaan ini, platform FMZ menaik taraf fungsi lukisan tersuai dan mengembangkan penggunaannya.KLineChartFungsi ini melaksanakan lukisan carta tersuai. Anda boleh merujuk kepada dokumentasi API: https://www.fmz.com/api#klinechart
Mari gunakan JavaScript untuk menulis contoh mudah untuk membuat peralihan.
Contoh Mudah
javascript
/*backtest
start: 2022-03-21 09:00:00
end: 2022-06-21 15:00:00
period: 30m
basePeriod: 15m
exchanges: [{"eid":"Binance","currency":"BTC_USDT"}]
*/
function main() {
var c = KLineChart()
while (true) {
var bars = _C(exchange.GetRecords)
for (var i = 0 ; i < bars.length ; i++) {
var bar = bars[i]
c.begin(bar)
c.plot(bar.Volume, "volume")
c.close()
}
Sleep(1000)
}
}
Contoh ini sangat mudah. Ia hanya melukis carta candlestick dalam kawasan lukisan tersuai strategi, dan melukis lengkung kelantangan yang sepadan dengan setiap BAR candlestick dalam kedudukan subcarta carta.
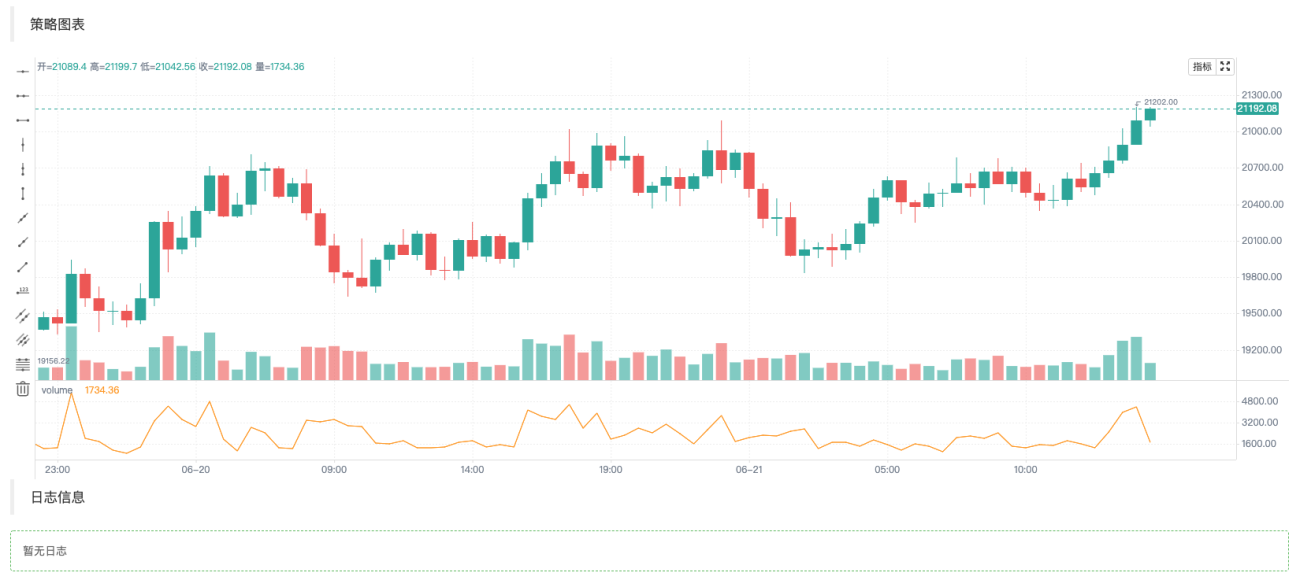
Dalam kod yang pertama kali kita gunakanvar c = KLineChart()Cipta objek carta dan kemudian panggil kaedahnya untuk melukis. Kemudian dalam gelung kita mendapat data K-line (struktur tatasusunan) dan melintasi tatasusunan garis-K. Anda boleh menggunakan gelung mudah untuk melintasi seperti dalam contoh, atau anda boleh menggunakan kaedah lain untuk melintasi.
Operasi lukisan hendaklah dilakukan daric.begin(bar)Fungsi bermula,c.close()Fungsi tamat.begin、closeFungsi ialah kaedah bagi objek carta c. Seterusnya, gunakan fungsi lukisan yang paling biasa digunakanplotLukiskan lengkung isipadu pada setiap BAR.
Contoh yang lebih kompleks
Katakan kita ingin mereka bentuk carta dengan penunjuk Bollinger. Oh ya! Anda juga perlu melampirkan carta volum untuk setiap BAR, yang boleh direka bentuk seperti ini:
            javascript

            /*backtest
start: 2022-03-21 09:00:00
end: 2022-06-21 15:00:00
period: 1d
basePeriod: 1h
exchanges: [{"eid":"Binance","currency":"BTC_USDT"}]
*/

function main() {
    var c = KLineChart()

    // 策略主循环
    while(true) {
        // 轮询间隔
        Sleep(500)

        // 获取K线数据
        let bars = exchange.GetRecords()
        if (!bars || bars.length <= 20) {
            continue
        }

        // 计算布林指标
        var boll = TA.BOLL(bars)

        bars.forEach(function(bar, index) {
            c.begin(bar)
            // 画图操作
            c.plot(boll[0][index], "Boll_Up", {overlay: true})     // 画在图表主图
            c.plot(boll[1][index], "Boll_Mid", {overlay: true})    // 画在图表主图
            c.plot(boll[2][index], "Boll_Down", {overlay: true})   // 画在图表主图
            c.plot(bar.Volume, "volume")                           // 画在图表副图
            c.close()
        })

        // 策略交易逻辑
        // ...
        // ..
    }
}
Anda boleh melihat dalam kod bahawa maklumat konfigurasi ujian belakang kami pada platform FMZ ialah:
            python

            /*backtest
start: 2022-03-21 09:00:00
end: 2022-06-21 15:00:00
period: 1d
basePeriod: 1h
exchanges: [{"eid":"Binance","currency":"BTC_USDT"}]
*/
Konfigurasi ini diuji belakang menggunakan objek pertukaran tempat Binance Hasil ujian belakang ditunjukkan dalam rajah:
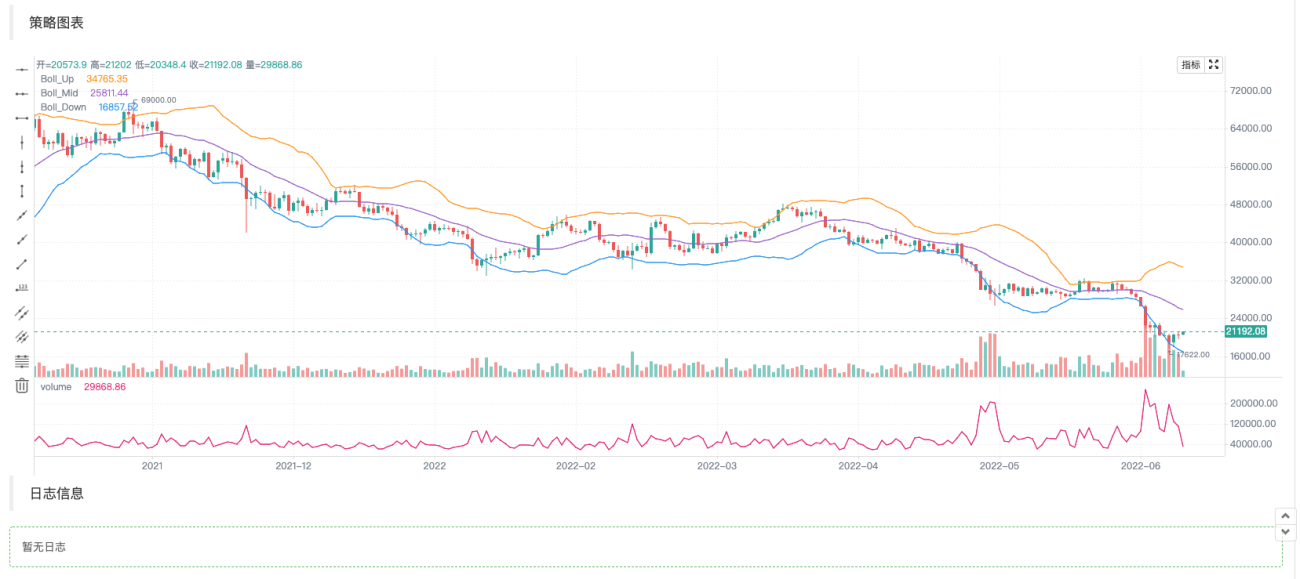
Dapat dilihat bahawa kami menggunakan kaedah lukisan Pine untuk memudahkan kod lukisan dalam bahasa JavaScript.
Tulis penunjuk dan data lain untuk melukis gambar
Operasi seperti mendapatkan data K-line dan pengiraan penunjuk adalah perkara biasa dan sangat mudah dalam contoh strategi dan dokumen API bagi petak strategi platform.
            javascript

                    // 获取K线数据
        let bars = exchange.GetRecords()
        if (!bars || bars.length <= 20) {
            // 如果获取K线失败,即!bar为真则执行continue,忽略之后的代码,重新执行循环
            // 如果bars.length小于等于20,即K线BAR(柱)数量小于20,无法计算指标,也执行continue
            continue
        }

        // 计算布林指标
        var boll = TA.BOLL(bars)
Fungsi pengiraan penunjuk Bollinger TA.BOLL, jika anda tidak menyatakan parameter penunjuk Bollinger, parameter lalai digunakanBOLL(20, 2). Penunjuk Bollinger mempunyai tiga baris, jadi data yang dikembalikan oleh fungsi TA.BOLL ialah tatasusunan dua dimensi. boll[0]、boll[1]、boll[2] ialah tiga elemen tatasusunan boll, setiap satunya mewakili baris dan tatasusunan.
- boll[0]: Bollinger Bands Dalam Talian
- boll[1]: Garis Tengah Bollinger Bands
- boll[2]: Bollinger Bands Turun
Kemudian kita akan melihat cara untuk menarik volum data K-line, iaitu volum dagangan, dan data penunjuk Bollinger yang dikira pada carta.
Kami melukis bar data K-line mengikut bar, jadi kami perlu melintasi keseluruhan tatasusunan K-line, iaitu, melintasi tatasusunan bar dalam kod. Di sini kita gunakanforEachTraversal kaedah juga boleh dilalui menggunakan gelung for.
            javascript

                    bars.forEach(function(bar, index) {
            c.begin(bar)
            // 画图操作
            c.plot(boll[0][index], "Boll_Up", {overlay: true})     // {overlay: true}参数控制,画在图表主图
            c.plot(boll[1][index], "Boll_Mid", {overlay: true})    // 画在图表主图
            c.plot(boll[2][index], "Boll_Down", {overlay: true})   // 画在图表主图
            c.plot(bar.Volume, "volume")                           // 画在图表副图
            c.close()
        })
Perlu diingatkan bahawa setiap kali anda mula melukis carta pada bar, anda mesti terlebih dahuluc.begin(bar)Panggilan fungsi,beginFungsi ialah kaedah bagi objek carta kami c. Pada penghujung operasi lukisan, anda perlu memanggilc.close(). wujudbeginFungsi dancloseDi antara fungsi adalah fungsi lukisan yang kami panggil yang serupa dengan kaedah lukisan bahasa Pine. sokongan:barcolor bgcolor plot fill hline plotarrow plotshape plotchar plotcandle signal, anda boleh melukis garisan, anak panah, menandakan maklumat, dsb. Parameter fungsi ini adalah konsisten dengan parameter fungsi yang sepadan dalam bahasa Pine, dan fungsi lukisan juga konsisten.
Menambahkan anak panah isyarat dagangan, penanda, garisan mendatar dan lukisan lain
Tambahkan beberapa anak panah isyarat dagangan, penanda dan garisan mendatar pada contoh lukisan penunjuk Bollinger di atas.
            javascript

            /*backtest
start: 2022-03-21 09:00:00
end: 2022-06-21 15:00:00
period: 1d
basePeriod: 1h
exchanges: [{"eid":"Binance","currency":"BTC_USDT"}]
*/

function main() {
    var c = KLineChart()

    // 策略主循环
    while(true) {
        // 轮询间隔
        Sleep(500)

        // 获取K线数据
        let bars = exchange.GetRecords()
        if (!bars || bars.length <= 20) {
            continue
        }

        // 计算布林指标
        var boll = TA.BOLL(bars)

        bars.forEach(function(bar, index) {
            c.begin(bar)
            // 画图操作
            c.plot(boll[0][index], "Boll_Up", {overlay: true})     // 画在图表主图
            c.plot(boll[1][index], "Boll_Mid", {overlay: true})    // 画在图表主图
            c.plot(boll[2][index], "Boll_Down", {overlay: true})   // 画在图表主图
            c.plot(bar.Volume, "volume")                           // 画在图表副图

            c.hline(bar.Open, {overlay: true})                                         // 水平线
            c.plotarrow(bar.Close - bar.Open, {overlay: true})                         // 箭头
            c.plotshape(bar.Close - bar.Open > 0, {style: 'square', overlay: true})    // 画方块标记
            c.plotchar(bar.Close - bar.Open < 0, {char: '❄', size: "20px", overlay: true})           // 画出字符❄
            if (boll[0][index] && bar.Close > boll[0][index]) {
                c.signal("long", bar.Close, 1.5)
            } else if (boll[2][index] && bar.Close < boll[2][index]) {
                c.signal("closelong", bar.Close, 1.5)
            }

            c.close()
        })

        // 策略交易逻辑
        // ...
        // ..
    }
}
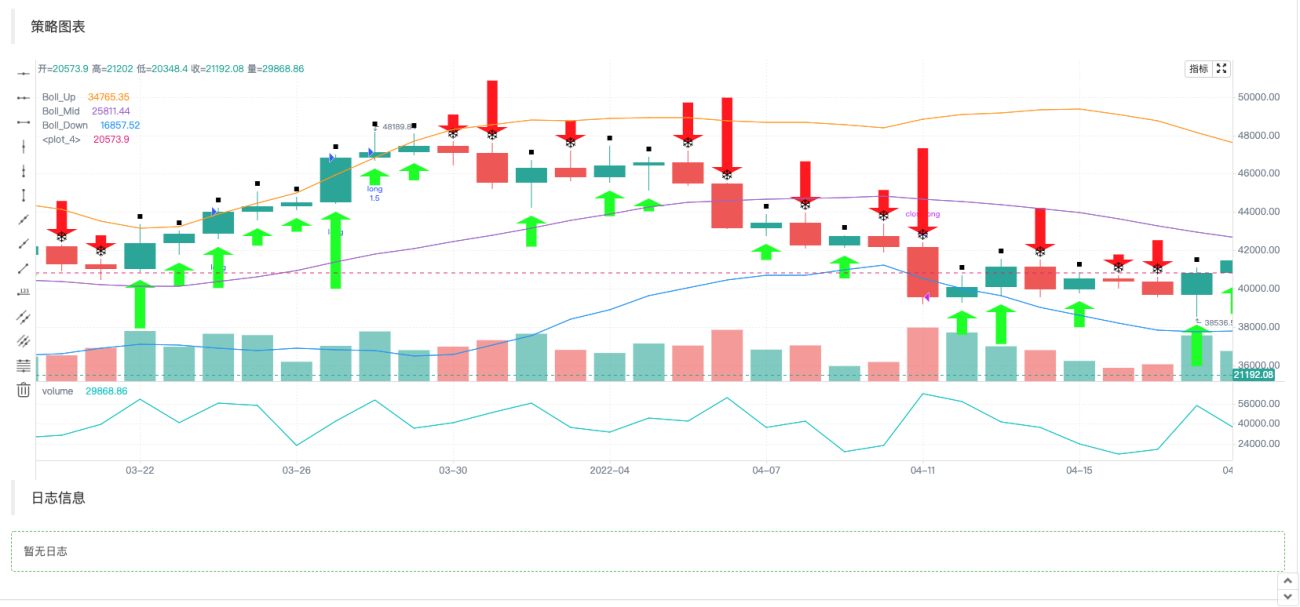
Memandangkan operasi susunan strategi bahasa Pine akan menandakan isyarat secara automatik pada carta,KLineChartObjek carta yang dicipta oleh fungsi juga dilanjutkan dengan fungsi untuk melukis penanda isyarat beli dan jual:c.signal。
Objek konfigurasi carta
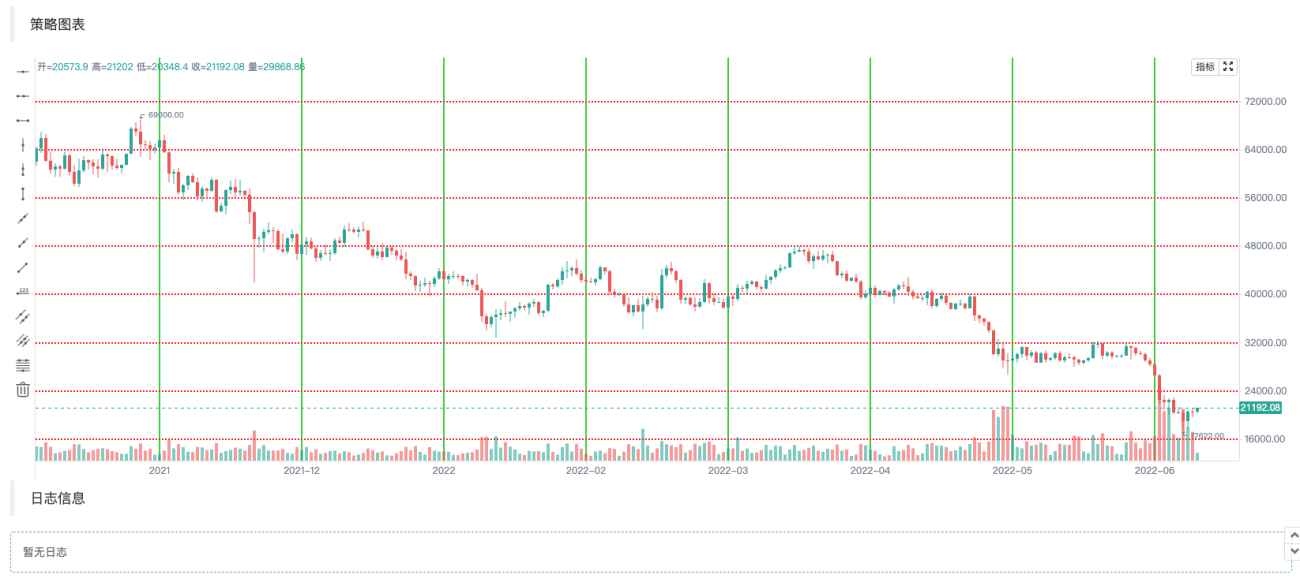
Anda boleh mengisytiharkan struktur untuk mengkonfigurasi gaya carta Contohnya, pembolehubah cartaCfg berikut mewakili maklumat konfigurasi garis grid.
            javascript

                var chartCfg = {
        grid: {
            show: true,
            // 网格水平线
            horizontal: {
                show: true,
                size: 2,
                color: '#FF0000',    // 水平网格线的颜色
                // 'solid'|'dash'
                style: 'dash',       // 线的类型
                dashValue: [2, 2]
            },
   	        // 网格垂直线
            vertical: {
                show: true,
                size: 2,
                color: '#32CD32',
                // 'solid'|'dash'
                style: 'solid',
                dashValue: [2, 2]
            }
        },
    }
Objek konfigurasi carta ialah struktur data yang menetapkan beberapa sifat dan penampilan carta Contohnya, contoh menggunakan konfigurasi gaya garisan grid. Terdapat juga banyak pilihan yang boleh dikonfigurasikan dan diubah suai, seperti tetapan berkaitan paksi X dan paksi Y, tetapan garis kursor, tetapan maklumat segera, tetapan gaya penunjuk teknikal, tetapan gaya BAR K-line, dsb.
Sudah tentu, jika anda tidak biasa dengan ini,KLineChartFungsi ini tidak perlu lulus dalam objek konfigurasi carta apabila mencipta objek carta. Carta yang dibuat adalah daripada gaya lalai. Menggunakan fungsi API platform FMZKLineChartFungsi untuk mencipta objek carta:
            javascript

            var c = KLineChart(chartCfg)
Kod ujian untuk melukis garisan grid:
            javascript

            /*backtest
start: 2022-03-21 09:00:00
end: 2022-06-21 15:00:00
period: 1d
basePeriod: 1h
exchanges: [{"eid":"Binance","currency":"BTC_USDT"}]
*/

function main() {
    var chartCfg = {
        grid: {
            show: true,
            // 网格水平线
            horizontal: {
                show: true,
                size: 2,
                color: '#FF0000',
                // 'solid'|'dash'
                style: 'dash',
                dashValue: [2, 2]
            },
   	        // 网格垂直线
            vertical: {
                show: true,
                size: 2,
                color: '#32CD32',
                // 'solid'|'dash'
                style: 'solid',
                dashValue: [2, 2]
            }
        },
    }

    var c = KLineChart(chartCfg)

    // 策略主循环
    while(true) {
        // 轮询间隔
        Sleep(500)

        // 获取K线数据
        var bars = _C(exchange.GetRecords)
        bars.forEach(function(bar, index) {
            c.begin(bar)
            c.close()
        })

        // 策略交易逻辑
        // ...
        // ..
    }
}
Contoh Gaya Konfigurasi Carta
Boleh digunakan untuk merujuk tetapan gaya konfigurasi carta.
javascript
{
// 网格线
grid: {
show: true,
// 网格水平线
horizontal: {
show: true,
size: 1,
color: '#393939',
// 'solid'|'dash'
style: 'dash',
dashValue: [2, 2]
},
// 网格垂直线
vertical: {
show: false,
size: 1,
color: '#393939',
// 'solid'|'dash'
style: 'dash',
dashValue: [2, 2]
}
},
// 蜡烛图
candle: {
// 蜡烛图上下间距,大于1为绝对值,大于0小余1则为比例
margin: {
top: 0.2,
bottom: 0.1
},
// 蜡烛图类型 'candle_solid'|'candle_stroke'|'candle_up_stroke'|'candle_down_stroke'|'ohlc'|'area'
type: 'candle_solid',
// 蜡烛柱
bar: {
upColor: '#26A69A',
downColor: '#EF5350',
noChangeColor: '#888888'
},
// 面积图
area: {
lineSize: 2,
lineColor: '#2196F3',
value: 'close',
backgroundColor: [{
offset: 0,
color: 'rgba(33, 150, 243, 0.01)'
}, {
offset: 1,
color: 'rgba(33, 150, 243, 0.2)'
}]
},
priceMark: {
show: true,
// 最高价标记
high: {
show: true,
color: '#D9D9D9',
textMargin: 5,
textSize: 10,
textFamily: 'Helvetica Neue',
textWeight: 'normal'
},
// 最低价标记
low: {
show: true,
color: '#D9D9D9',
textMargin: 5,
textSize: 10,
textFamily: 'Helvetica Neue',
textWeight: 'normal',
},
// 最新价标记
last: {
show: true,
upColor: '#26A69A',
downColor: '#EF5350',
noChangeColor: '#888888',
line: {
show: true,
// 'solid'|'dash'
style: 'dash',
dashValue: [4, 4],
size: 1
},
text: {
show: true,
size: 12,
paddingLeft: 2,
paddingTop: 2,
paddingRight: 2,
paddingBottom: 2,
color: '#FFFFFF',
family: 'Helvetica Neue',
weight: 'normal',
borderRadius: 2
}
}
},
// 提示
tooltip: {
// 'always' | 'follow_cross' | 'none'
showRule: 'always',
// 'standard' | 'rect'
showType: 'standard',
labels: ['时间', '开', '收', '高', '低', '成交量'],
values: null,
defaultValue: 'n/a',
rect: {
paddingLeft: 0,
paddingRight: 0,
paddingTop: 0,
paddingBottom: 6,
offsetLeft: 8,
offsetTop: 8,
offsetRight: 8,
borderRadius: 4,
borderSize: 1,
borderColor: '#3f4254',
backgroundColor: 'rgba(17, 17, 17, .3)'
},
text: {
size: 12,
family: 'Helvetica Neue',
weight: 'normal',
color: '#D9D9D9',
marginLeft: 8,
marginTop: 6,
marginRight: 8,
marginBottom: 0
}
}
},
// 技术指标
technicalIndicator: {
margin: {
top: 0.2,
bottom: 0.1
},
bar: {
upColor: '#26A69A',
downColor: '#EF5350',
noChangeColor: '#888888'
},
line: {
size: 1,
colors: ['#FF9600', '#9D65C9', '#2196F3', '#E11D74', '#01C5C4']
},
circle: {
upColor: '#26A69A',
downColor: '#EF5350',
noChangeColor: '#888888'
},
// 最新值标记
lastValueMark: {
show: false,
text: {
show: false,
color: '#ffffff',
size: 12,
family: 'Helvetica Neue',
weight: 'normal',
paddingLeft: 3,
paddingTop: 2,
paddingRight: 3,
paddingBottom: 2,
borderRadius: 2
}
},
// 提示
tooltip: {
// 'always' | 'follow_cross' | 'none'
showRule: 'always',
// 'standard' | 'rect'
showType: 'standard',
showName: true,
showParams: true,
defaultValue: 'n/a',
text: {
size: 12,
family: 'Helvetica Neue',
weight: 'normal',
color: '#D9D9D9',
marginTop: 6,
marginRight: 8,
marginBottom: 0,
marginLeft: 8
}
}
},
// x轴
xAxis: {
show: true,
height: null,
// x轴线
axisLine: {
show: true,
color: '#888888',
size: 1
},
// x轴分割文字
tickText: {
show: true,
color: '#D9D9D9',
family: 'Helvetica Neue',
weight: 'normal',
size: 12,
paddingTop: 3,
paddingBottom: 6
},
// x轴分割线
tickLine: {
show: true,
size: 1,
length: 3,
color: '#888888'
}
},
// y轴
yAxis: {
show: true,
width: null,
// 'left' | 'right'
position: 'right',
// 'normal' | 'percentage' | 'log'
type: 'normal',
inside: false,
reverse: false,
// y轴线
axisLine: {
show: true,
color: '#888888',
size: 1
},
// y轴分割文字
tickText: {
show: true,
color: '#D9D9D9',
family: 'Helvetica Neue',
weight: 'normal',
size: 12,
paddingLeft: 3,
paddingRight: 6
},
// y轴分割线
tickLine: {
show: true,
size: 1,
length: 3,
color: '#888888'
}
},
// 图表之间的分割线
separator: {
size: 1,
color: '#888888',
fill: true,
activeBackgroundColor: 'rgba(230, 230, 230, .15)'
},
// 十字光标
crosshair: {
show: true,
// 十字光标水平线及文字
horizontal: {
show: true,
line: {
show: true,
// 'solid'|'dash'
style: 'dash',
dashValue: [4, 2],
size: 1,
color: '#888888'
},
text: {
show: true,
color: '#D9D9D9',
size: 12,
family: 'Helvetica Neue',
weight: 'normal',
paddingLeft: 2,
paddingRight: 2,
paddingTop: 2,
paddingBottom: 2,
borderSize: 1,
borderColor: '#505050',
borderRadius: 2,
backgroundColor: '#505050'
}
},
// 十字光标垂直线及文字
vertical: {
show: true,
line: {
show: true,
// 'solid'|'dash'
style: 'dash',
dashValue: [4, 2],
size: 1,
color: '#888888'
},
text: {
show: true,
color: '#D9D9D9',
size: 12,
family: 'Helvetica Neue',
weight: 'normal',
paddingLeft: 2,
paddingRight: 2,
paddingTop: 2,
paddingBottom: 2,
borderSize: 1,
borderColor: '#505050',
borderRadius: 2,
backgroundColor: '#505050'
}
}
},
// 图形
shape: {
point: {
backgroundColor: '#2196F3',
borderColor: '#2196F3',
borderSize: 1,
radius: 4,
activeBackgroundColor: '#2196F3',
activeBorderColor: '#2196F3',
activeBorderSize: 1,
activeRadius: 6
},
line: {
// 'solid'|'dash'
style: 'solid'
color: '#2196F3',
size: 1,
dashValue: [2, 2]
},
polygon: {
// 'stroke'|'fill'
style: 'stroke',
stroke: {
// 'solid'|'dash'
style: 'solid',
size: 1,
color: '#2196F3',
dashValue: [2, 2]
},
fill: {
color: 'rgba(33, 150, 243, 0.1)'
}
},
arc: {
// 'stroke'|'fill'
style: 'stroke',
stroke: {
// 'solid'|'dash'
style: 'solid',
size: 1,
color: '#2196F3',
dashValue: [2, 2]
},
fill: {
color: '#2196F3'
}
},
text: {
style: 'fill',
color: '#2196F3',
size: 12,
family: 'Helvetica Neue',
weight: 'normal',
offset: [0, 0]
}
},
annotation: {
// 'top' | 'bottom' | 'point'
position: 'top',
offset: [20, 0]
symbol: {
// 'diamond' | 'circle' | 'rect' | 'triangle' | 'custom' | 'none'
type: 'diamond',
size: 8,
color: '#2196F3',
activeSize: 10,
activeColor: '#FF9600'
}
},
tag: {
// 'top' | 'bottom' | 'point'
position: 'point',
offset: 0,
line: {
show: true,
style: LineStyle.DASH,
dashValue: [4, 2],
size: 1,
color: '#2196F3'
},
text: {
color: '#FFFFFF',
backgroundColor: '#2196F3',
size: 12,
family: 'Helvetica Neue',
weight: 'normal',
paddingLeft: 2,
paddingRight: 2,
paddingTop: 2,
paddingBottom: 2,
borderRadius: 2,
borderSize: 1,
borderColor: '#2196F3'
},
mark: {
offset: 0,
color: '#FFFFFF',
backgroundColor: '#2196F3',
size: 12,
family: 'Helvetica Neue',
weight: 'normal',
paddingLeft: 2,
paddingRight: 2,
paddingTop: 2,
paddingBottom: 2,
borderRadius: 2,
borderSize: 1,
borderColor: '#2196F3'
}
}
}
Bukankah ini menjadikan lukisan dan reka bentuk strategi lebih mudah?

梦总,感谢分享!
我请教一个场景,不知道现阶段使用KLineChart能否实现。 具体场景说明:
1、策略是多品种交易 ;
2、加载策略的时候,默认指定的品种进行图表的绘制,包括K线、指标、交易信号等等;
3、通过筛选框,选择其他的交易品种,获取历史K线绘制图表,直到当前时间对应的K线。
目的在于通过图表直接观察各个交易品种是否是合理开平仓的,交易是否正常。

1、策略是多品种交易 ;
对于多图表,KLineChart 函数不支持,可以使用画图接口Chart函数,可以参考多图表画线类库的设计。
2、加载策略的时候,默认指定的品种进行图表的绘制,包括K线、指标、交易信号等等;
单图表可以实现。
3、通过筛选框,选择其他的交易品种,获取历史K线绘制图表,直到当前时间对应的K线。
单图表可以实现,可以具体编写代码查询历史K线数据然后填充画图.
如果是多品种策略,建议使用Chart函数画图。KLineChart 函数目前只能单图表画图。
- 1