Strategi Pelarian Mengekori

Gambaran keseluruhan
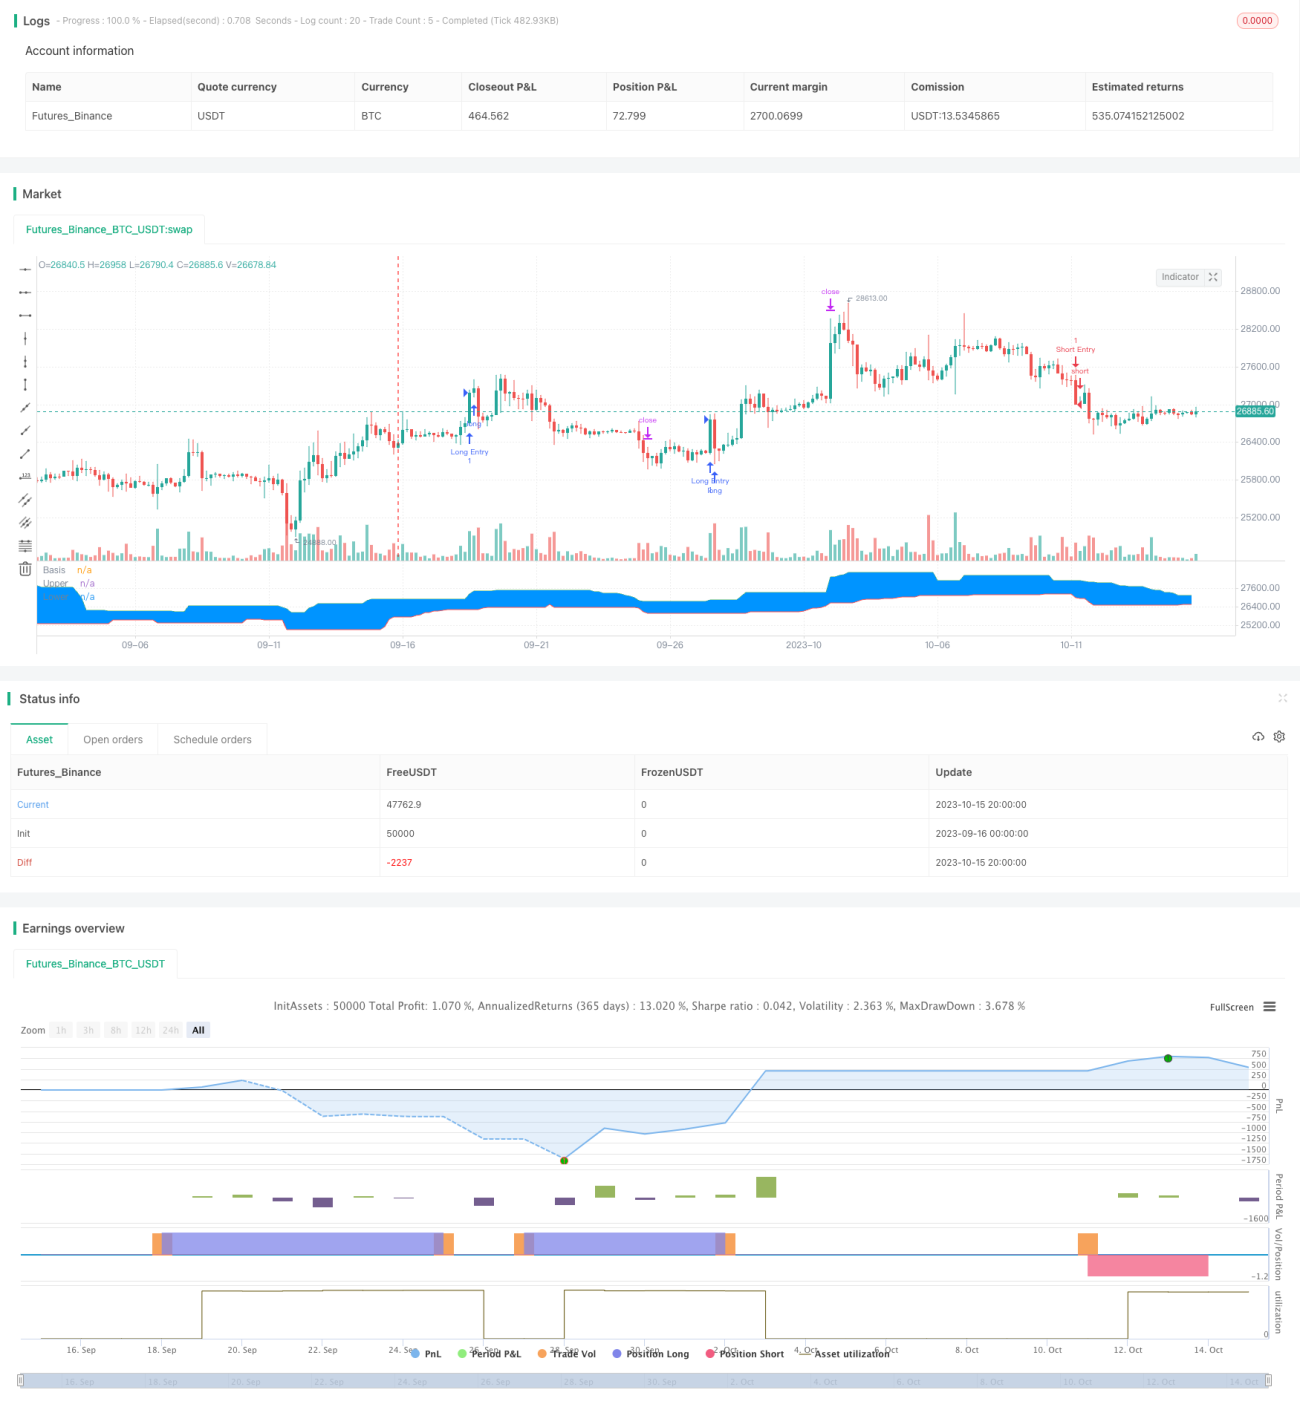
Strategi ini digunakan untuk mencapai strategi pelacakan pelacakan yang disokong oleh indikator penghalang saluran Yangtze An. Strategi ini menggabungkan trend dan dua jenis pemikiran perdagangan yang melanggar, berdasarkan penghakiman trend garis panjang, mencari titik pecah yang lebih pendek untuk membuat entri, dan mencapai perdagangan yang lancar dalam keadaan trend. Selain itu, strategi ini juga menetapkan tahap stop loss dan berhenti untuk mengawal nisbah risiko dan keuntungan setiap perdagangan.
Prinsip Strategi
-
Tetapkan parameter untuk penunjuk saluran saluran Deng Dongqian, kitaran lalai 20;
-
Tetapkan EMA rata-rata bergerak yang lancar, kitaran lalai 200;
-
Tetapkan nisbah risiko-kebajikan, secara lalai 1.5;
-
Tetapkan parameter penembusan dan langkah balik, masing-masing untuk multihead dan kosong;
-
Mencatat apakah satu penembusan adalah satu titik tinggi atau satu titik rendah;
-
Isyarat multi-head: menghasilkan isyarat multi-head jika penembusan sebelumnya adalah titik rendah dan harga lebih tinggi daripada tren atas Dongguan dan lebih tinggi daripada garis rata-rata EMA;
-
Isyarat kosong: menghasilkan isyarat kosong jika penembusan sebelumnya adalah titik tinggi dan harga berada di bawah tren bawah Dongguan dan di bawah garis rata-rata EMA;
-
Setelah memasuki kedudukan berbilang mata, set stop loss untuk mundur 5 mata ke bawah rel Dongjian, dan stop loss untuk perbandingan risiko-keuntungan kali jarak stop loss;
-
Selepas memasuki kedudukan kosong, set stop loss untuk Tang Chian naik ke rel mundur 5 mata, stop stop untuk risiko keuntungan berbanding kali jarak stop loss.
Dengan cara ini, strategi yang digabungkan dengan penghakiman trend dan operasi penembusan, dapat secara beransur-ansur, menangkap peluang untuk tempoh yang lebih pendek dalam trend garis panjang. Pada masa yang sama, penyetempatan Stop Loss Stop Stop boleh mengawal risiko keuntungan perdagangan tunggal.
Analisis kelebihan
-
Mengikuti trend garis panjang, mengikut trend, dan mengelakkan perdagangan berlawanan arah.
-
Laluan Dongxian digunakan sebagai penunjuk garis panjang, yang digabungkan dengan penapis garis seragam EMA, untuk menentukan arah trend.
-
Mekanisme penangguhan kerugian mengawal setiap risiko, yang boleh mengehadkan kemungkinan kerugian.
-
Mengoptimumkan nisbah risiko dan keuntungan, anda boleh meningkatkan nisbah kerugian dan mengejar keuntungan tambahan.
-
Tetapan parameter pengesan adalah fleksibel, yang membolehkan anda menyesuaikan kombinasi parameter terbaik untuk pasaran yang berbeza.
Analisis risiko
-
Laluan Dongxian dan EMA sebagai penapis, mungkin memberi isyarat yang salah.
-
"Pengurusan terobosan mudah ditiru dan memerlukan latar belakang trend yang jelas untuk dikenal pasti.
-
Jarak stop loss tetap dan tidak boleh disesuaikan dengan turun naik pasaran.
-
Parameters Optimisasi ruang yang terhad, kesan cakera keras sukar dijamin.
-
Sistem perdagangan tidak boleh diuji dengan terlalu banyak peristiwa rawak, dan peristiwa Black Swan boleh menyebabkan kerugian yang besar.
Arah pengoptimuman
-
Anda boleh pertimbangkan untuk menambahkan lebih banyak penapis, seperti penapis getaran, untuk meningkatkan kualiti isyarat.
-
Anda boleh menetapkan Hentian Kerugian Pintar untuk menyesuaikan kedudukan kerugian dan kerugian anda mengikut turun naik pasaran dan pergerakan indikator ATR.
-
Kaedah seperti pembelajaran mesin boleh digunakan untuk menguji dan mengoptimumkan parameter, menjadikannya lebih dekat dengan pasaran sebenar.
-
Logik kemasukan boleh dioptimumkan dengan menetapkan VOLUME atau indikator kadar turun naik sebagai syarat tambahan untuk mengelakkan perangkap.
-
Ia boleh dipertimbangkan untuk digabungkan dengan strategi trend-following atau pembelajaran mesin untuk membentuk strategi campuran dan meningkatkan kestabilan.
ringkaskan
Strategi ini sebagai strategi penembusan jenis pengesanan, idea utamanya adalah untuk menilai trend garis panjang, untuk melakukan operasi melintang sebagai isyarat, dan menetapkan stop loss untuk mengawal risiko perdagangan tunggal. Strategi ini mempunyai kelebihan tertentu, tetapi ada juga ruang untuk pengoptimuman. Secara keseluruhan, jika dapat menangani parameter yang baik, penetapan pilihan masa masuk, dan ditambah dengan teknologi lain, strategi ini boleh menjadi strategi pengesanan trend yang praktikal.
/*backtest
start: 2023-09-16 00:00:00
end: 2023-10-16 00:00:00
period: 4h
basePeriod: 15m
exchanges: [{"eid":"Futures_Binance","currency":"BTC_USDT"}]
*/

//@version=4
// Welcome to my second script on Tradingview with Pinescript
// First of, I'm sorry for the amount of comments on this script, this script was a challenge for me, fun one for sure, but I wanted to thoroughly go through every step before making the script public
// Glad I did so because I fixed some weird things and I ended up forgetting to add the EMA into the equation so our entry signals were a mess- 1