
Strategi ini menggunakan gabungan beberapa indikator bentuk asas untuk mengenal pasti masa-masa perubahan besar, mengambil strategi berhenti kehilangan trend, dan bertujuan untuk mendapatkan keuntungan melebihi berhenti.
Strategi ini adalah berdasarkan kepada beberapa indikator berikut untuk menilai pembalikan dasar:
Noro’s BottomSensivity: menentukan sama ada garis K mempunyai bentuk bawah tertentu.
Indeks Keinginan Kepastian ((CVI): menilai psikologi kosong berhadapan dengan perubahan.
Penunjuk akhir ((UCS): menilai keadaan yang melampaui jatuh dari garis rata-rata.
RSI: menilai keadaan oversold.
Komposisi bentuk: termasuk pelbagai bentuk asas seperti kerucut, paku.
Strategi ini menggunakan beberapa kombinasi indikator dasar, menghasilkan isyarat beli apabila jumlah bentuk dasar yang ditetapkan oleh parameter strategi dipenuhi. Strategi ini juga memasukkan penilaian indikator RSI untuk penyaringan penipuan palsu, dan hanya akan mencetuskan pembelian apabila oversold.
Pengguna boleh menyesuaikan penggunaan dan parameter setiap indikator penghakiman bawah, mewujudkan fleksibiliti yang tinggi. Pada masa yang sama, strategi untuk memasukkan penapis rata-rata SMA, mengelakkan melakukan lebih banyak di bawah trend.
Menggunakan pelbagai penunjuk untuk meningkatkan kepastian
Parameter penunjuk yang boleh disesuaikan untuk pelbagai jenis
Penapisan rata SMA untuk mengelakkan penarikan
Ia boleh dikonfigurasikan hanya untuk laluan K merah untuk mengurangkan risiko.
Alarm pop-up, pemantauan dalam masa nyata
Penghakiman gabungan mungkin terlepas bahagian bawah
Bottomline tidak selalu bertukar
Perhatian perlu diberikan kepada jumlah transaksi untuk menyokong perubahan.
Mengoptimumkan konfigurasi parameter penunjuk, menyesuaikan untuk pelbagai jenis
Meningkatkan pengurusan kedudukan dan mengurangkan kos dengan menambah stok
Meningkatkan strategi berhenti kerugian dan mengesan trend berhenti kerugian
Strategi ini memanfaatkan penilaian pelbagai indikator untuk meningkatkan ketepatan pengenalan asas, dan mengawal risiko dengan berkesan dengan mengesan trend untuk menghentikan kerugian dan mengunci keuntungan. Namun, masih perlu memperhatikan apakah jumlah perdagangan dapat menyokong trend pembalikan. Pengguna boleh mengoptimumkan parameter berdasarkan ciri-ciri varieti untuk menyesuaikan diri dengan keadaan pasaran yang berbeza.
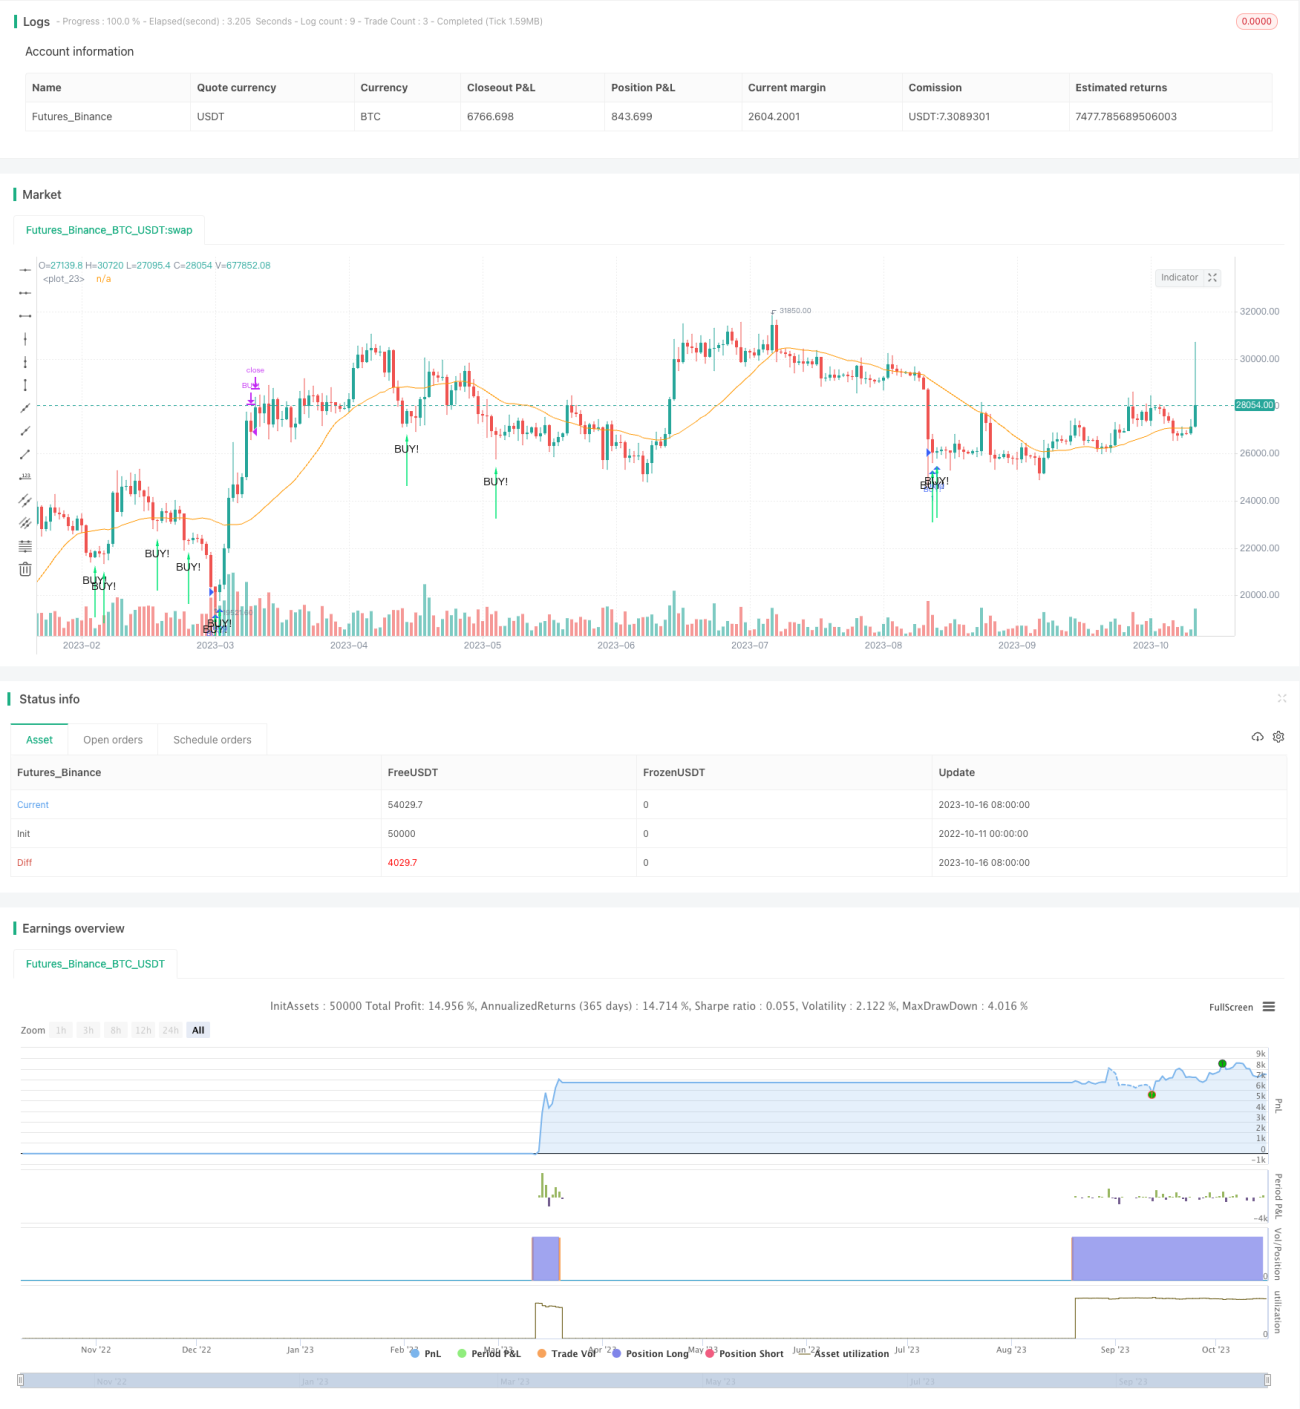
/*backtest
start: 2022-10-11 00:00:00
end: 2023-10-17 00:00:00
period: 1d
basePeriod: 1h
exchanges: [{"eid":"Futures_Binance","currency":"BTC_USDT"}]
*/
// the original indicator is Noro's BottomSensivity v0.6
//@version=4
strategy("Noro's BottomSensivity v0.6 strategy + rsi + Alarm", shorttitle="Bottom 0.6 StRsiAlarm", overlay=true)
overSold = input(35)
overBought = input(70)
botsens = input(defval = 3, minval = 1, maxval = 4, title = "Bottom-Sensivity")
smalen = input(defval = 25, minval = 20, maxval = 200, title = "SMA Length")
bars = input(defval = 3, minval = 2, maxval = 4, title = "Bars of Locomotive")
useloc = input(true, title = "Use bottom-pattern Locomotive?")
usepin = input(true, title = "Use bottom-pattern Pin-bar?")
usecvi = input(true, title = "Use bottom-indicator CVI?")
useucs = input(true, title = "Use bottom-indicator UCS?")
usevix = input(true, title = "Use bottom-indicator WVF?")
usersi = input(true, title = "Use bottom-indicator RSI?")
usered = input(false, title = "Only red candles?")
usesma = input(true, title = "Use SMA Filter?")
showsma = input(false, title = "Show SMA Filter?")
//SMA Filter
sma = sma(close, smalen)
colsma = showsma == true ? red : na
plot(sma, color = colsma)
//VixFix method
//Start of ChrisMoody's code
pd = 22
bbl = 20
mult = 2
lb = 50
ph = .85
pl = 1.01
hp = false
sd = false
wvf = ((highest(close, pd)-low)/(highest(close, pd)))*100
sDev = mult * stdev(wvf, bbl)
midLine = sma(wvf, bbl)
lowerBand = midLine - sDev
upperBand = midLine + sDev
rangeHigh = (highest(wvf, lb)) * ph
rangeLow = (lowest(wvf, lb)) * pl
//End of ChrisMoody's code
//Locomotive mmethod
bar = close > open ? 1 : close < open ? -1 : 0
locob = bar == 1 and bar[1] == -1 and bar[2] == -1 and (bar[3] == -1 or bars < 3) and (bar[4] == -1 or bars < 4) ? 1 : 0
//PIN BAR
body = abs(close - open)
upshadow = open > close? (high - open) : (high - close)
downshadow = open > close ? (close - low) : (open - low)
pinbar = open[1] > close[1] ? (body[1] > body ? (downshadow > 0.5 * body ? (downshadow > 2 * upshadow ? 1 : 0 ) : 0 ) : 0 ) : 0
//CVI method
//Start of LazyBear's code
ValC=sma(hl2, 3)
bull=-.51
bear=.43
vol=sma(atr(3), 3)
cvi = (close-ValC) / (vol*sqrt(3))
cb= cvi <= bull ? green : cvi >=bear ? red : cvi > bull ? blue : cvi < bear ? blue : na
bull1 = cvi <= bull
bear1 = cvi >= bear
bull2 = bull1[1] and not bull1
bear2 = bear1[1] and not bear1
//End of LazyBear's code
//UCS method
//Start of UCS's code
ll = lowest(low, 5)
hh = highest(high, 5)
diff = hh - ll
rdiff = close - (hh+ll)/2
avgrel = ema(ema(rdiff,3),3)
avgdiff = ema(ema(diff,3),3)
mom = ((close - close[3])/close[3])*1000
SMI = avgdiff != 0 ? (avgrel/(avgdiff/2)*100) : 0
SMIsignal = ema(SMI,3)
ucslong = SMI < -35 and mom > 0 and mom[1] < 0 ? 1 : 0
//End of UCS's code
//RSI method
//Chris Moody's code
up = rma(max(change(close), 0), 2)
down = rma(-min(change(close), 0), 2)
rsi = down == 0 ? 100 : up == 0 ? 0 : 100 - (100 / (1 + up / down))
rsib = rsi < 10 ? 1 : 0
//Chris Moody's code
//sum
locobot = useloc == false ? 0 : locob
vixfixbot = usevix == false ? 0 : wvf >= upperBand or wvf >= rangeHigh ? 1 : 0
cvibot = usecvi == false ? 0 : bull2 == true ? 1 : 0
ucsbot = useucs == false ? 0 : ucslong == 1 ? 1 : 0
rsibot = usersi == false ? 0 : rsib
pinbot = usepin == false ? 0 : pinbar
score = vixfixbot + locobot + cvibot + ucsbot + rsibot + pinbot
//arrows
bottom = usered == false ? usesma == false ? score >= botsens ? 1 : 0 : high < sma and score >= botsens ? 1 : 0 : usesma == false ? score >= botsens and close < open ? 1 : 0 : high < sma and score >= botsens and close < open ? 1 : 0
plotarrow(bottom == 1 ? 1 : na, title="Buy arrow", colorup=lime, maxheight=60, minheight=50, transp=0)
data = bottom == 1
plotchar(data, char=" ", text="BUY!", location=location.belowbar, color=green, size=size.small)
//Market buy and exit
strategy.entry("BUY!", strategy.long, when =(bottom == 1) and(rsi(close,14)<overSold))
strategy.close("BUY!", when = (crossunder(rsi(close,14), overBought)))
alarm = bottom == 1 and(rsi(close,14)<overSold)
alertcondition(alarm == 1,title="BUY+RSI",message="BUY+RSI")