
Ini adalah strategi perdagangan kuantitatif yang menggabungkan pelbagai petunjuk teknikal untuk membuat keputusan kosong. Strategi ini mempertimbangkan pelbagai faktor seperti indikator momentum, indikator trend, dan grafik awan Ichimoku untuk membentuk keputusan pembelian akhir. Strategi ini mempunyai kestabilan dan ketahanan risiko yang kuat.
Strategi ini terdiri daripada beberapa bahagian:
Penunjuk momentum: Parabolic SAR, Penunjuk intensiti Leledc, Kaufman Adaptive Moving Average dan lain-lain
Indikator Trend: Rahul Mohindar Vibrator, Trend Magic dan sebagainya
Imej Awan Ichimoku: termasuk Jalur Tenkan, Jalur Kijun dan lain-lain
Penunjuk Aliran Jilid
Penunjuk turun naik: Wave Trend Oscillator
Siri TD
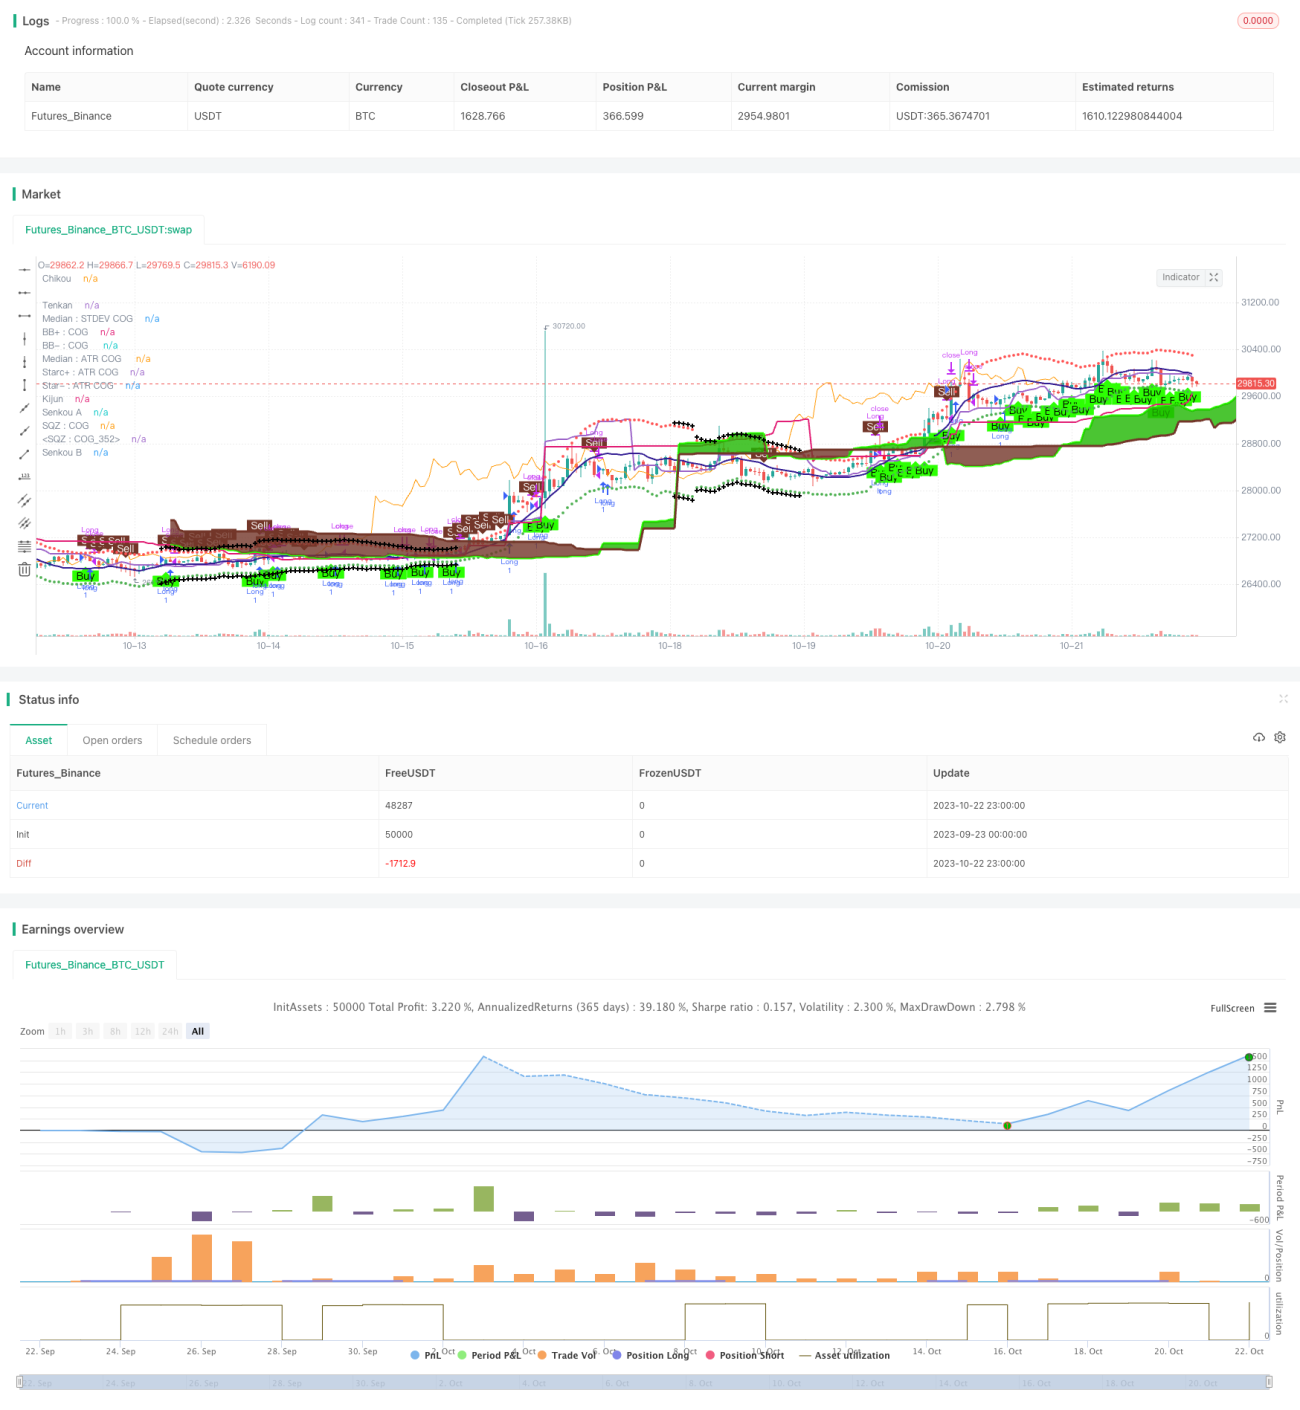
Indikator-indikator ini menilai trend dan kekuatan pasaran semasa dari sudut yang berbeza. Parabolic SAR menilai titik perubahan trend, indikator kekuatan Ledc menilai momentum, dan grafik awan Ichimoku menilai tekanan sokongan. Apabila kebanyakan indikator memberikan isyarat arah, keputusan pembelian atau penjualan akhirnya dibentuk.
Strategi ini juga menetapkan syarat penapisan untuk berdagang hanya pada tarikh yang ditetapkan setiap bulan, setiap hari, untuk mengurangkan jumlah perdagangan yang tidak sah.
Keputusan komprehensif pelbagai faktor, peningkatan ketepatan, dan ketahanan terhadap risiko yang lebih kuat
Memperkenalkan pelbagai jenis penunjuk untuk disahkan, mengelakkan risiko kegagalan satu penunjuk
Tetapkan syarat penapisan untuk mengelakkan perdagangan yang tidak sah pada masa yang tidak sesuai
Penulisan menggunakan Pine Script, mudah dan cepat untuk digunakan secara langsung di platform TradingView
Parameter penunjuk boleh disesuaikan dan boleh dioptimumkan untuk pasaran yang berbeza
Memaparkan isyarat penunjuk secara visual, menilai struktur pasaran secara intuitif
Kombinasi multifaktor memerlukan penyesuaian berat dan parameter, dan terdapat kesukaran untuk mengoptimumkannya
Indeks tunggal mungkin tidak berkesan dalam keadaan pasaran tertentu
Kaedah penapisan yang tidak betul boleh menyebabkan peluang terlewat
Berhati-hati untuk mengelakkan optimasi yang berlebihan
Pedagang perlu memberi perhatian kepada risiko kegagalan penunjuk dan menyesuaikan strategi dengan segera
Kaedah pencegahan:
Mengoptimumkan parameter penyesuaian penunjuk untuk menjadikannya lebih berkesan untuk pasaran semasa
Menyesuaikan berat badan, meningkatkan peranan penunjuk berkesan, mengurangkan peranan penunjuk tidak berkesan
Menyesuaikan keadaan penapisan mengikut peluang dan risiko
Menambah algoritma pembelajaran mesin untuk menyesuaikan berat indeks secara automatik
Meningkatkan faktor-faktor seperti sentimen, aliran wang dan sebagainya
Uji varieti dan tempoh perdagangan untuk menetapkan parameter optimum
Uji Kesan Berbeza Waktu Pemilihan
Dengan penapisan tambahan seperti data bermusim, ekonomi dan sebagainya
Tambah strategi henti kerugian
Strategi ini menggabungkan beberapa indikator untuk membentuk keputusan akhir, dengan kelebihan ketahanan risiko yang kuat. Pada masa yang sama, anda juga perlu memberi perhatian kepada risiko kegagalan indikator tunggal, terus mengoptimumkan dan menyesuaikan parameter. Pada masa akan datang, anda boleh mengoptimumkan lagi penentuan berat indikator, menambah lebih banyak faktor, menguji tempoh memegang kedudukan yang optimum, dan sebagainya.
//@version=2
persistent_bull = nz(persistent_bull[1],0)
persistent_bear = nz(persistent_bear[1],0)
strategy("Strategy for The Bitcoin Buy/Sell Indicator", overlay=true, calc_on_every_tick=true)
// ****************************************Inputs***************************************************************
//@fixme if there is a buy and sell signal on the same bar, then it displays the first one and skips the second one. Fix this issue
buySellSignal = true // Make this false if you do not want to show Buy/Sell signal
inputIndividualSiganlPlot = true // = input (false, "Do you want to display each individual indicator's signal on the chart?")
sp = input (false, "Do you want to display Parabolic SAR?")
spLines = input (false, "Do you want to display Parabolic SAR on the chart?")
sCloud = input(false, "Do you want to display the Tenkan and Kijun lines of Ichimoku lines on the chart?")
sL = input (false, "Do you want to display Leledec Exhausion - Leledc on the chart?")
sTD = false
sRMO = input(false, "Do you want to display Rahul Mohindar Oscillator - RMO on the chart?")
inputAma = input(false, title="Do you want to display Kaufman AMA wave - AMA on the chart?")
tm = input (false, "Do you want to display Trend Magic signals on the chart?")
wtoLB = input (false, "Do you want to display WaveTrend Oscillator - WTO on the chart?")
vfiLB = input (false, "Do you want to display Volume Flow Indicator - VFI on the chart?")
cogRegionFillTransp = 100 // input(false, "Do you want to display COG Region Fill and ATR Starc+/-")
inputNeutralMinorSignals = input (false, title="Do you want to not display the minor or the not so strong signals from Ichimoku")
maj=true // input(true,title="Show Major Leledc Exhausion Bar signal")
min=input(false,title="Show Minor Leledc Exhausion Bar signal")
tenkanPeriods = input(20, minval=9, title="Tenkan Period - Ichimoku [9 or 10 or 20]")
kijunPeriods = input(60, minval=26, title="Kijun Period - Ichimoku [26 or 30 or 60]")
chikouPeriods = input(120, minval=52, title="Chikou - Ichimoku [52 or 60 or 120]")
displacement = input(30, minval=26, title="Displacement - Ichimoku [26 or 30]")
// ****************************************General Color Variables***************************************************************
colorLime = #006400 // Warning sign for long trade
colorBuy= #2DFF03 // Good sign for long trade
colorSell = #733629 // Good sign for short trade
colorMaroon =#8b0000 // Warning sign for short trade
colorBlue =#0000ff // No clear sign
colorGray = #a9a9a9 // Gray Color (For Squeeze momentum indicator)
colorBlack = #000000 // Black
colorWhite = #ffffff // White
colorTenkanViolet = #800000 // Tenkan-sen line color
colorKijun = #0000A6 // Kijun-sen line color
// TD Sequential bar colors
tdSell = #ff6666
tdSellOvershoot = #ff1a1a
tdSellOvershoot1 = #cc0000
tdSellOverShoot2 = #990000
tdSellOverShoot3 = #732626
tdBuy = #80ff80
tdBuyOverShoot = #33ff33
tdBuyOvershoot1 = #00cc00
tdBuyOverShoot2 = #008000
tdBuyOvershoot3 = #004d00
// ****************************************Icons***************************************************************
upSign = '↑' // indicates the indicator shows uptrend
downSign = '↓' // incicates the indicator showing downtrend
exitSign ='x' //indicates the indicator uptrend/downtrend ending
// diamond signals weakBullishSignal or weakBearishsignal
// flag signals neutralBullishSignal or neutralBearishSignal
// ****************************************Parabolic SAR code***************************************************************
start = 2
increment = 2
maximum = 2
sus = true
sds = true
disc = false
startCalc = start * .01
incrementCalc = increment * .01
maximumCalc = maximum * .10
sarUp = sar(startCalc, incrementCalc, maximumCalc)
sarDown = sar(startCalc, incrementCalc, maximumCalc)
colUp = spLines and close >= sarDown ? colorLime : na
colDown = spLines and close <= sarUp ? colorSell : na
//@fixme Does not display the correct values for up and down pSAR
plot(sp and sus and sarUp ? sarUp : na, title="↓ SAR", style=cross, linewidth=3,color=colUp)
plot(sp and sds and sarDown ? sarDown : na, title="↑ SAR", style=circles, linewidth=3,color=colDown)
startSAR = 0.02
incrementSAR = 0.02
maximumSAR = 0.2
psar = sar(startSAR, incrementSAR, maximumSAR)
bullishPSAR = psar < high and psar[1] > low
bearishPSAR= psar > low and psar[1] < high
//***********************Leledc Exhausion Bar***********************************************
maj_qual=6
maj_len=30
min_qual=5
min_len=5
lele(qual,len)=>
bindex=nz(bindex[1],0)
sindex=nz(sindex[1],0)
ret=0
if (close>close[4])
bindex:=bindex + 1
if(close<close[4])
sindex:=sindex + 1
if (bindex>qual) and (close<open) and high>=highest(high,len)
bindex:=0
ret:=-1
if ((sindex>qual) and (close>open) and (low<= lowest(low,len)))
sindex:=0
ret:=1
return=ret
major=lele(maj_qual,maj_len)
minor=lele(min_qual,min_len)
leledecMajorBullish = maj ? (major==1?low:na) : na
leledecMajorBearish = maj ? (major==-1?high:na) : na
//****************Ichimoku ************************************
donchian(len) => avg(lowest(len), highest(len))
tenkan = donchian(tenkanPeriods)
kijun = donchian(kijunPeriods)
senkouA = avg(tenkan, kijun)
senkouB = donchian(chikouPeriods)
displacedSenkouA = senkouA[displacement]
displacedSenkouB = senkouB[displacement]
bullishSignal = crossover(tenkan, kijun)
bearishSignal = crossunder(tenkan, kijun)
bullishSignalValues = iff(bullishSignal, tenkan, na)
bearishSignalValues = iff(bearishSignal, tenkan, na)
strongBullishSignal = crossover(tenkan, kijun) and bullishSignalValues > displacedSenkouA and bullishSignalValues > displacedSenkouB and low > tenkan and displacedSenkouA > displacedSenkouB
strongBearishSignal = bearishSignalValues < displacedSenkouA and bearishSignalValues < displacedSenkouB and high < tenkan and displacedSenkouA < displacedSenkouB
neutralBullishSignal = (bullishSignalValues > displacedSenkouA and bullishSignalValues < displacedSenkouB) or (bullishSignalValues < displacedSenkouA and bullishSignalValues > displacedSenkouB)
weakBullishSignal = bullishSignalValues < displacedSenkouA and bullishSignalValues < displacedSenkouB
neutralBearishSignal = (bearishSignalValues > displacedSenkouA and bearishSignalValues < displacedSenkouB) or (bearishSignalValues < displacedSenkouA and bearishSignalValues > displacedSenkouB)
weakBearishSignal = bearishSignalValues > displacedSenkouA and bearishSignalValues > displacedSenkouB
//*********************Kaufman AMA wave*********************//
src=close
lengthAMA=20
filterp = 10
d=abs(src-src[1])
s=abs(src-src[lengthAMA])
noise=sum(d, lengthAMA)
efratio=s/noise
fastsc=0.6022
slowsc=0.0645
smooth=pow(efratio*fastsc+slowsc, 2)
ama=nz(ama[1], close)+smooth*(src-nz(ama[1], close))
filter=filterp/100 * stdev(ama-nz(ama), lengthAMA)
amalow=ama < nz(ama[1]) ? ama : nz(amalow[1])
amahigh=ama > nz(ama[1]) ? ama : nz(amahigh[1])
bw=(ama-amalow) > filter ? 1 : (amahigh-ama > filter ? -1 : 0)
s_color=bw > 0 ? colorBuy : (bw < 0) ? colorSell : colorBlue
amaLongConditionEntry = s_color==colorBuy and s_color[1]!=colorBuy
amaShortConditionEntry = s_color==colorSell and s_color[1]!=colorSell
//***********************Rahul Mohindar Oscillator ******************************//
C=close
cm2(x) => sma(x,2)
ma1=cm2(C)
ma2=cm2(ma1)
ma3=cm2(ma2)
ma4=cm2(ma3)
ma5=cm2(ma4)
ma6=cm2(ma5)
ma7=cm2(ma6)
ma8=cm2(ma7)
ma9=cm2(ma8)
ma10=cm2(ma9)
SwingTrd1 = 100 * (close - (ma1+ma2+ma3+ma4+ma5+ma6+ma7+ma8+ma9+ma10)/10)/(highest(C,10)-lowest(C,10))
SwingTrd2=ema(SwingTrd1,30)
SwingTrd3=ema(SwingTrd2,30)
RMO= ema(SwingTrd1,81)
Buy=cross(SwingTrd2,SwingTrd3)
Sell=cross(SwingTrd3,SwingTrd2)
Bull_Trend=ema(SwingTrd1,81)>0
Bear_Trend=ema(SwingTrd1,81)<0
Ribbon_kol=Bull_Trend ? colorBuy : (Bear_Trend ? colorSell : colorBlue)
Impulse_UP= SwingTrd2 > 0
Impulse_Down= RMO < 0
bar_kol=Impulse_UP ? colorBuy : (Impulse_Down ? colorSell : (Bull_Trend ? colorBuy : colorBlue))
rahulMohindarOscilllatorLongEntry = Ribbon_kol==colorBuy and Ribbon_kol[1]!=colorBuy and Ribbon_kol[1]==colorSell and bar_kol==colorBuy
rahulMohindarOscilllatorShortEntry = Ribbon_kol==colorSell and Ribbon_kol[1]!=colorSell and Ribbon_kol[1]==colorBuy and bar_kol==colorSell
//***********************TD Sequential code ******************************//
transp=0
Numbers=false
SR=false
Barcolor=true
TD = close > close[4] ?nz(TD[1])+1:0
TS = close < close[4] ?nz(TS[1])+1:0
TDUp = TD - valuewhen(TD < TD[1], TD , 1 )
TDDn = TS - valuewhen(TS < TS[1], TS , 1 )
priceflip = barssince(close<close[4])
sellsetup = close>close[4] and priceflip
sell = sellsetup and barssince(priceflip!=9)
sellovershoot = sellsetup and barssince(priceflip!=13)
sellovershoot1 = sellsetup and barssince(priceflip!=14)
sellovershoot2 = sellsetup and barssince(priceflip!=15)
sellovershoot3 = sellsetup and barssince(priceflip!=16)
priceflip1 = barssince(close>close[4])
buysetup = close<close[4] and priceflip1
buy = buysetup and barssince(priceflip1!=9)
buyovershoot = barssince(priceflip1!=13) and buysetup
buyovershoot1 = barssince(priceflip1!=14) and buysetup
buyovershoot2 = barssince(priceflip1!=15) and buysetup
buyovershoot3 = barssince(priceflip1!=16) and buysetup
TDbuyh = valuewhen(buy,high,0)
TDbuyl = valuewhen(buy,low,0)
TDsellh = valuewhen(sell,high,0)
TDselll = valuewhen(sell,low,0)
//***********************Volume Flow Indicator [LazyBear] ******************************//
lengthVFI = 130
coefVFI = 0.2
vcoefVFI = 2.5
signalLength= 5
smoothVFI=true
ma(x,y) => smoothVFI ? sma(x,y) : x
typical=hlc3
inter = log( typical ) - log( typical[1] )
vinter = stdev(inter, 30 )
cutoff = coefVFI * vinter * close
vave = sma( volume, lengthVFI )[1]
vmax = vave * vcoefVFI
vc = iff(volume < vmax, volume, vmax)
mf = typical - typical[1]
vcp = iff( mf > cutoff, vc, iff ( mf < -cutoff, -vc, 0 ) )
vfi = ma(sum( vcp , lengthVFI )/vave, 3)
vfima=ema( vfi, signalLength )
dVFI=vfi-vfima
bullishVFI = vfi > 0 and vfi[1] <=0
bearishVFI = vfi < 0 and vfi[1] >=0
//***********************WaveTrend Oscillator [WT] ******************************//
n1 = 10
n2 = 21
obLevel1 = 60
obLevel2 = 53
osLevel1 = -60
osLevel2 = -53
ap = hlc3
esa = ema(ap, n1)
dWTI = ema(abs(ap - esa), n1)
ci = (ap - esa) / (0.015 * dWTI)
tci = ema(ci, n2)
wt1 = tci
wt2 = sma(wt1,4)
wtiSignal = wt1-wt2
bullishWTI = wt1 > osLevel1 and wt1[1] <= osLevel1 and wtiSignal > 0
bearishWTI = wt1 < obLevel1 and wt1[1] >= obLevel1 and wtiSignal < 0
// **************** Trend Magic code adapted from Glaz ********************* /
CCI = 20 // input(20)
ATR = 5 // input(5)
Multiplier=1 // input(1,title='ATR Multiplier')
original=true // input(true,title='original coloring')
thisCCI = cci(close, CCI)
lastCCI = nz(thisCCI[1])
bufferDn= high + Multiplier * sma(tr,ATR)
bufferUp= low - Multiplier * sma(tr,ATR)
if (thisCCI >= 0 and lastCCI < 0)
bufferUp := bufferDn[1]
if (thisCCI <= 0 and lastCCI > 0)
bufferDn := bufferUp[1]
if (thisCCI >= 0)
if (bufferUp < bufferUp[1])
bufferUp := bufferUp[1]
else
if (thisCCI <= 0)
if (bufferDn > bufferDn[1])
bufferDn := bufferDn[1]
x=thisCCI >= 0 ?bufferUp:thisCCI <= 0 ?bufferDn:x[1]
swap=x>x[1]?1:x<x[1]?-1:swap[1]
swap2=swap==1?lime:red
swap3=thisCCI >=0 ?lime:red
swap4=original?swap3:swap2
bullTrendMagic = swap4 == lime and swap4[1] == red
bearTrendMagic = swap4 == red and swap4[1] == lime
// ************ Indicator: Custom COG channel by Lazy Bear **************** //
srcCOG = close
lengthCOG = 34
median=0
multCOG= 2.5 // input(2.5)
offset = 20 //input(20)
tr_custom() =>
x1=high-low
x2=abs(high-close[1])
x3=abs(low-close[1])
max(x1, max(x2,x3))
atr_custom(x,y) =>
sma(x,y)
dev = (multCOG * stdev(srcCOG, lengthCOG))
basis=linreg(srcCOG, lengthCOG, median)
ul = (basis + dev)
ll = (basis - dev)
tr_v = tr_custom()
acustom=(2*atr_custom(tr_v, lengthCOG))
uls=basis+acustom
lls=basis-acustom
// Plot STDEV channel
plot(basis, linewidth=1, color=navy, style=line, linewidth=1, title="Median : STDEV COG")
lb=plot(ul, color=red, linewidth=1, title="BB+ : COG", style=hline.style_dashed)
tb=plot(ll, color=green, linewidth=1, title="BB- : COG ", style=hline.style_dashed)
fill(tb,lb, silver, title="Region fill: STDEV COG", transp=cogRegionFillTransp)
// Plot ATR channel
plot(basis, linewidth=2, color=navy, style=line, linewidth=2, title="Median : ATR COG ")
ls=plot(uls, color=red, linewidth=1, title="Starc+ : ATR COG", style=circles, transp=cogRegionFillTransp)
ts=plot(lls, color=green, linewidth=1, title="Star- : ATR COG", style=circles, transp=cogRegionFillTransp)
fill(ts,tb, green, title="Region fill : ATR COG", transp=cogRegionFillTransp)
fill(ls,lb, red, title="Region fill : ATR COG", transp=cogRegionFillTransp)
// Mark SQZ
plot_offs_high=0.002
plot_offs_low=0.002
sqz_f=(uls>ul) and (lls<ll)
b_color=sqz_f ? colorBlack : na
plot(sqz_f ? lls - (lls * plot_offs_low) : na, color=b_color, style=cross, linewidth=3, title="SQZ : COG", trasp=0)
plot(sqz_f ? uls + (uls * plot_offs_high) : na, color=b_color, style=cross, linewidth=3, title="SQZ : COG", trasp=0)
// ****************************************All the plots and coloring of bars***************************************************************
// Trend Magic
plotchar(tm and bullTrendMagic, title="TM", char=upSign, location=location.belowbar, color=colorBuy, transp=0, text="TM", textcolor=colorBuy, size=size.auto)
plotchar(tm and bearTrendMagic, title="TM", char=downSign, location=location.abovebar, color=colorSell, transp=0, text="TM", textcolor=colorSell, size=size.auto)
// WaveTrend Oscillator
plotshape(wtoLB and bullishWTI, color=colorBuy, style=shape.labelup, textcolor=#000000, text="WTI", location=location.belowbar, transp=0)
plotshape(wtoLB and bearishWTI, color=colorSell, style=shape.labeldown, textcolor=#ffffff, text="WTI", location=location.abovebar, transp=0)
// VFI
plotshape(vfiLB and bullishVFI, color=colorBuy, style=shape.labelup, textcolor=#000000, text="VFI", location=location.belowbar, transp=0)
plotshape(vfiLB and bearishVFI, color=colorSell, style=shape.labeldown, textcolor=#ffffff, text="VFI", location=location.abovebar, transp=0)
// PSAR
plotshape(inputIndividualSiganlPlot and sp and bullishPSAR, color=colorBuy, style=shape.labelup, textcolor=#000000, text="Sar", location=location.belowbar, transp=0)
plotshape(inputIndividualSiganlPlot and sp and bearishPSAR, color=colorSell, style=shape.labeldown, textcolor=#ffffff, text="Sar", location=location.abovebar, transp=0)
// Leledec
plotshape(inputIndividualSiganlPlot and sL and leledecMajorBearish, color=colorSell, style=shape.labeldown, textcolor=#ffffff, text="Leledec", location=location.abovebar, transp=0)
plotshape(inputIndividualSiganlPlot and sL and leledecMajorBullish, color=colorBuy, style=shape.labelup, textcolor=#000000, text="Leledec", location=location.belowbar, transp=0)
plotshape(min ? (minor==1?low:na) : na, style=shape.diamond, text="Leledec", size=size.tiny, location=location.belowbar, title="Weak Bullish Signals - Leledec", color=colorLime)
plotshape(min ? (minor==-1?high:na) : na, style=shape.diamond, text="Leledec", size=size.tiny, location=location.abovebar, title="Weak Bearish Signals - Leleded", color=colorSell)
// Ichimoku
plot(tenkan, color=iff(sCloud, colorTenkanViolet, na), title="Tenkan", linewidth=2, transp=0)
plot(kijun, color=iff(sCloud, colorKijun, na), title="Kijun", linewidth=2, transp=0)
plot(close, offset = -displacement, color=iff(sCloud, colorLime, na), title="Chikou", linewidth=1)
p1 = plot(senkouA, offset=displacement, color=colorBuy, title="Senkou A", linewidth=3, transp=0)
p2 = plot(senkouB, offset=displacement, color=colorSell, title="Senkou B", linewidth=3, transp=0)
fill(p1, p2, color = senkouA > senkouB ? #1eb600 : colorSell)
plotshape(inputIndividualSiganlPlot and strongBearishSignal, color=colorSell, style=shape.labelup, textcolor=#000000, text="Ichimoku", location=location.abovebar, transp=0)
plotshape(inputIndividualSiganlPlot and strongBullishSignal, color=colorBuy, style=shape.labeldown, textcolor=#ffffff, text="Ichimoku", location=location.belowbar, transp=0)
plotshape(inputNeutralMinorSignals and neutralBullishSignal, style=shape.flag, text="Ichimoku", size=size.small, location=location.belowbar, title="Neutral Bullish Signals - Ichimoku", color=colorLime)
plotshape(inputNeutralMinorSignals and weakBullishSignal, style=shape.diamond, text="Ichimoku", size=size.tiny, location=location.belowbar, title="Weak Bullish Signals - Ichimoku", color=colorLime)
plotshape(inputNeutralMinorSignals and neutralBearishSignal, style=shape.flag, text="Ichimoku", size=size.small, location=location.abovebar, title="Neutral Bearish Signals - Ichimoku", color=colorMaroon)
plotshape(inputNeutralMinorSignals and weakBearishSignal, style=shape.diamond, text="Ichimoku", size=size.tiny, location=location.abovebar, title="Weak Bearish Signals - Ichimoku", color=colorMaroon)
// AMA
plotshape(inputIndividualSiganlPlot and inputAma and amaLongConditionEntry, color=colorBuy, style=shape.labelup, textcolor=#000000, text="AMA", location=location.belowbar, transp=0)
plotshape(inputIndividualSiganlPlot and inputAma and amaShortConditionEntry, color=colorSell, style=shape.labeldown, textcolor=#ffffff, text="AMA", location=location.abovebar, transp=0)
// RMO
plotshape(inputIndividualSiganlPlot and sRMO and rahulMohindarOscilllatorLongEntry, color=colorBuy, style=shape.labelup, textcolor=#000000, text="RMO", location=location.belowbar, transp=0)
plotshape(inputIndividualSiganlPlot and sRMO and rahulMohindarOscilllatorShortEntry, color=colorSell, style=shape.labeldown, textcolor=#ffffff, text="RMO", location=location.abovebar, transp=0)
// TD
plot(sTD and SR?(TDbuyh ? TDbuyl: na):na,style=circles, linewidth=1, color=red)
plot(sTD and SR?(TDselll ? TDsellh : na):na,style=circles, linewidth=1, color=lime)
barColour = sell? tdSell : buy? tdBuy : sellovershoot? tdSellOvershoot : sellovershoot1? tdSellOvershoot1 : sellovershoot2?tdSellOverShoot2 : sellovershoot3? tdSellOverShoot3 : buyovershoot? tdBuyOverShoot : buyovershoot1? tdBuyOvershoot1 : buyovershoot2? tdBuyOverShoot2 : buyovershoot3? tdBuyOvershoot3 : na
barcolor(color=barColour, title ="TD Sequential Bar Colour")
// ****************************************BUY/SELL Signal ***************************************************************
bull = leledecMajorBullish or bullishPSAR or strongBullishSignal or amaLongConditionEntry or rahulMohindarOscilllatorLongEntry or bullishVFI
bear = leledecMajorBearish or bearishPSAR or strongBearishSignal or amaShortConditionEntry or rahulMohindarOscilllatorShortEntry or bearishVFI
if bull
persistent_bull := 1
persistent_bear := 0
if bear
persistent_bull := 0
persistent_bear := 1
plotshape(bull and persistent_bull[1] != 1, style=shape.labelup, location=location.belowbar, color=colorBuy, text="Buy", textcolor=#000000, transp=0)
plotshape(bear and persistent_bear[1] != 1, style=shape.labeldown, color=colorSell, text="Sell", location=location.abovebar, textcolor =#ffffff, transp=0)
// ****************************************Alerts***************************************************************
// For global buy/sell
alertcondition(bull and persistent_bull[1] != 1, title='Buy', message='Buy')
alertcondition(bear and persistent_bear[1] != 1, title='Sell', message='Sell')
// Strategy
longCondition = leledecMajorBullish or bullishPSAR or strongBullishSignal or amaLongConditionEntry or rahulMohindarOscilllatorLongEntry or bullishVFI
closeLongCondition = leledecMajorBearish or bearishPSAR or strongBearishSignal or amaShortConditionEntry or rahulMohindarOscilllatorShortEntry or bearishVFI
monthfrom =input(1)
monthuntil =input(12)
dayfrom=input(1)
dayuntil=input(31)
yearfrom=input(2017)
yearuntil=input(2020)
leverage=input(1)
if (longCondition )
strategy.entry("Long", strategy.long, leverage, comment="Enter Long")
else
strategy.close("Long", when=closeLongCondition)
//if (closeLongCondition and month>=monthfrom and month <=monthuntil and dayofmonth>=dayfrom and dayofmonth <= dayuntil and year <= yearuntil and year>=yearfrom)
// strategy.entry("Short", strategy.short, leverage, comment="Enter Short")
//else
// strategy.close("Short", when=longCondition)