Strategi lintasan purata bergerak


Tarikh penciptaan: 2023-10-24 12:27:20 Akhirnya diubah suai: 2023-10-24 12:27:20
Salin: 1 Bilangan klik: 736
1
fokus pada
1617
Pengikut

Strategi lintasan purata bergerak

Gambaran keseluruhan

Strategi ini menggunakan pelbagai petunjuk teknikal seperti purata bergerak, indikator goyah, dan lain-lain, yang digabungkan dengan bentuk melintasi garis rata-rata, untuk mengenal pasti trend harga saham dan titik-titik perubahan turun dan turun, untuk membeli dan menjual.

Prinsip

Strategi ini terdiri daripada beberapa bahagian utama:

  1. Pilih julat: Tetapkan K untuk julat masa dalam minit, seperti 1 minit, 5 minit dan lain-lain.

  2. Pilih purata bergerak: konfigurasi parameter purata bergerak seperti EMA, SMA yang biasa digunakan, seperti garis 10 hari, garis 20 hari dan sebagainya.

  3. Pilih penunjuk guncangan: konfigurasi parameter penunjuk guncangan seperti RSI, MACD, William.

  4. Hitung isyarat beli dan jual: Menggunakan fungsi tersuai, mengira nilai purata bergerak dan indikator getaran. Isyarat beli dihasilkan apabila garis purata jangka pendek melintasi garis purata jangka panjang; Isyarat jual dihasilkan apabila garis purata jangka pendek melintasi garis purata jangka panjang.

  5. Sistem penarafan: Sinyal beli dan jual setiap indikator diberi skor berangka, kemudian diambil rata-rata, dan mendapat indeks penarafan keseluruhan. Indeks penarafan lebih besar dari 0 untuk isyarat beli, kurang dari 0 untuk isyarat jual.

  6. Isyarat dagangan: menghasilkan isyarat dagangan akhir berdasarkan indeks penilaian yang lebih besar atau lebih kecil daripada 0, untuk membeli atau menjual operasi.

Strategi ini menggunakan pelbagai penunjuk dalam kombinasi, yang dapat mengenal pasti trend harga dan titik-titik perubahan, meningkatkan kebolehpercayaan isyarat. Perlawanan garis lurus adalah isyarat teknikal trend yang berkesan, dan gabungan dengan penunjuk goyah membantu mengelakkan pecah palsu. Sistem penilaian juga menjadikan isyarat perdagangan lebih jelas.

Kelebihan

  • Gabungan antara penembusan garis rata dan pelbagai indikator getaran, isyarat dagangan lebih dipercayai dan mengelakkan isyarat palsu
  • Sistem penilaian menjadikan isyarat jual beli lebih jelas
  • Menggunakan fungsi tersuai untuk pengaturcaraan modular, struktur kod jelas
  • Menggunakan pelbagai tempoh masa untuk analisis gabungan, meningkatkan ketepatan
  • Pengaturan parameter yang dioptimumkan, seperti panjang RSI, MACD jangka masa rata-rata laju
  • Kelebihan fleksibiliti dengan parameter yang boleh disesuaikan dengan parameter dan parameter garis rata

Risiko yang wujud

  • Perkembangan saham di bursa besar berbeza
  • Frekuensi dagangan mungkin lebih tinggi, meningkatkan kos dagangan dan risiko tergelincir
  • Parameter pengoptimuman perlu diuji berulang kali untuk menyesuaikan diri dengan ciri-ciri saham yang berbeza
  • Terdapat beberapa risiko penarikan balik dan kerugian

Risiko ini boleh dikurangkan dengan:

  • Memilih Saham Bersama Pergerakan Bursa Besar
  • Sesuaikan masa pegangan dan kurangkan kekerapan dagangan
  • Tetapan parameter yang dioptimumkan untuk lebih sesuai dengan ciri-ciri saham
  • Menggunakan strategi henti kerugian untuk mengawal kerugian

Arah pengoptimuman

Strategi ini boleh dioptimumkan dengan cara berikut:

  1. Tambah lebih banyak petunjuk, seperti indikator kadar turun naik, isyarat penguatan
  2. Parameter pengoptimuman automatik yang digabungkan dengan kaedah pembelajaran mesin
  3. Tambah modul pilihan saham dan industri
  4. Gabungan kaedah pilihan saham kuantitatif
  5. Menggunakan penangguhan adaptasi dan penangguhan susulan
  6. Berfikir tentang keadaan yang lebih besar dan mengelakkan keadaan yang tidak pasti
  7. Menganalisis hasil dagangan dalam talian dan menyesuaikan berat penilaian

Secara keseluruhannya, strategi ini mengintegrasikan penembusan garis rata-rata dan pelbagai petunjuk, yang dapat mengenal pasti pergerakan harga secara berkesan. Tetapi perlu terus menguji pengoptimuman, mengawal risiko.

ringkaskan

Strategi ini menggunakan persilangan rata-rata sebagai isyarat perdagangan utama, ditambah dengan pelbagai indikator goyah, menggunakan sistem penilaian untuk menghasilkan isyarat beli dan jual yang jelas. Ia dapat mengenal pasti trend harga dan titik perubahan dengan berkesan, tetapi memerlukan kawalan frekuensi perdagangan, mengurangkan kos dan risiko perdagangan, dan juga memerlukan parameter pengoptimuman yang berterusan.
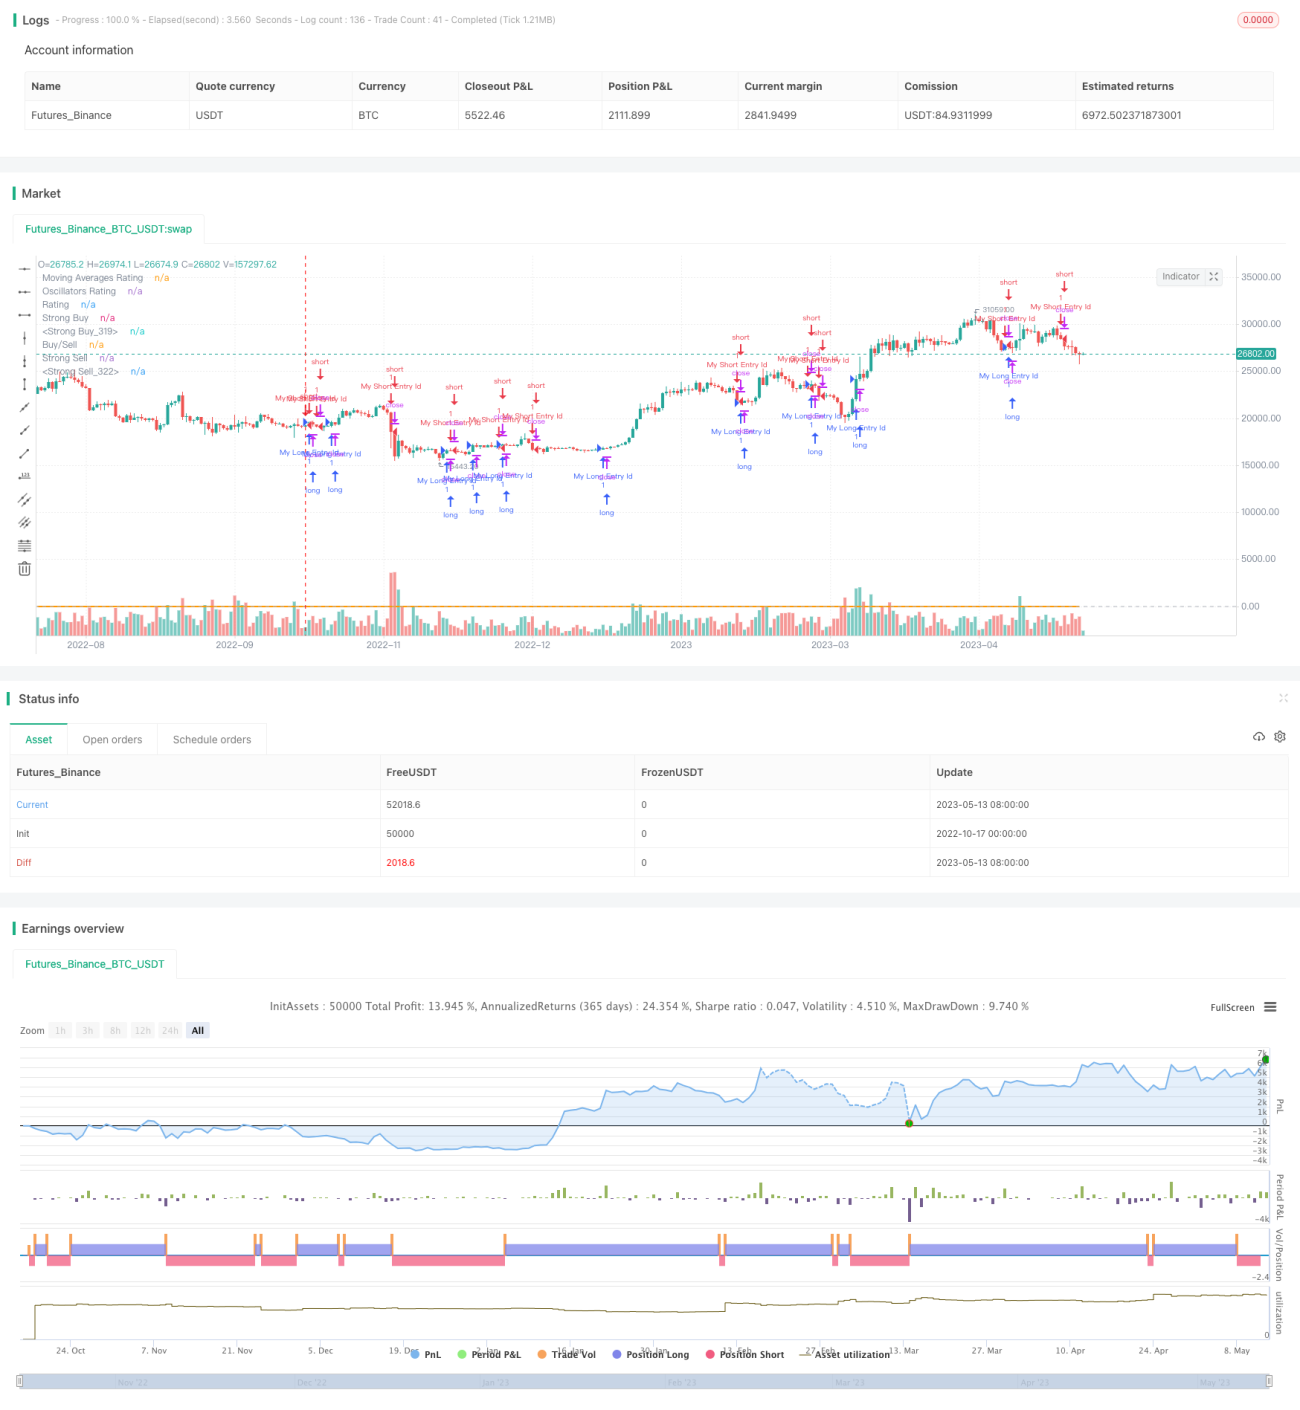
Kod sumber strategi
/*backtest
start: 2022-10-17 00:00:00
end: 2023-05-14 00:00:00
period: 1d
basePeriod: 1h
exchanges: [{"eid":"Futures_Binance","currency":"BTC_USDT"}]
*/

//@version=4
strategy("TV Signal", overlay=true, initial_capital = 500, currency = "USD")

// -------------------------------------- GLOBAL SELECTION --------------------------------------------- //
//res  = input(defval="5"  , title="resolution " , type=resolution)
res_num  = input("240", title="Resolution (minutes)", options=["1", "5", "15", "60", "240"] )
res = res_num
src  = close

// -----------------------------------MOVING AVERAGES SELECTION----------------------------------------- //
// EMAS input
ema10                 = 10
ema20                 = 20
ema30                 = 30
ema50                 = 50
ema100                = 100
ema200                = 200
// SMAS input
sma10                 = 10
sma20                 = 20
sma30                 = 30
sma50                 = 50
sma100                = 100
sma200                = 200
// Ichimoku - is not active in the calculation brought to you by TV TEAM for the lolz
// VWMA
vwma20                = 20
// Hull
hma9                  = 9

// -----------------------------------OSCILLATORS SELECTION----------------------------------------- //
//RSI
rsi_len         = input(14, minval=1, title="RSI Length")
//STOCH K
stoch_k         = input(14, minval=1, title="STOCH K")
stoch_d         = input(3,  minval=1, title="STOCH D")
stoch_smooth    = input(3,  minval=1, title="STOCH Smooth")
//CCI
cci_len         = input(20, minval=1, title="CCI Length")
//Momentum
momentum_len = input(10, minval=1, title="Momentum Length")
//MACD
macd_fast           = input(12,  title="MACD fast")
macd_slow           = input(27,  title="MACD slow")
//ADX
adxlen = input(14, title="ADX Smoothing")
dilen  = input(14, title="DI Length")
//BBP
bbp_len           = input(13,  title="BBP EMA Length")
//William Percentage Range
wpr_length = input(14, minval=1,  title="William Perc Range Length")
//Ultimate Oscillator
uo_length7 = input(7, minval=1, title="UO Length 7"), uo_length14 = input(14, minval=1, title="UO Length 14"), uo_length28 = input(28, minval=1, title="UO Length 28")
	
// -------------------------------------- FUNCTIONS - Moving Averages -------------------------------------- //
// Simple Moving Averages Calculation Function - SELL indicator values < price // BUY – indicator values > price
calc_sma_index(len, src, res) =>	
    sma_val = request.security(syminfo.tickerid, res, sma(src, len))
    sma_index  = if( sma_val > close )
        -1
    else
        1
    sma_index
// Exponential Moving Averages Calculation Function - SELL indicator values < price // BUY – indicator values > price 
calc_ema_index(len, src, res) =>	
    ema_val = request.security(syminfo.tickerid, res, sma(src, len))
    ema_index  = if( ema_val > close )
        -1
    else
        1
    ema_index
// Hull Moving Averages Calculation Function - SELL indicator values < price // BUY – indicator values > price   
calc_hull_index(len, src, res) =>
    hull_val = request.security(syminfo.tickerid, res, wma(2*wma(src, len/2)-wma(src, len), round(sqrt(len))))
    hull_index  = if( hull_val > close )
        -1
    else
        1
    hull_index
// VW Moving Averages Calculation Function - SELL indicator values < price // BUY – indicator values > price  
calc_vwma_index(len, src, res) =>  
    vwma_val = request.security(syminfo.tickerid, res, vwma(src, len))
    vwma_index  = if( vwma_val > close )
        -1
    else
        1
    vwma_index
// -------------------------------------- FUNCTIONS - Oscillators -------------------------------------- //
// RSI indicator < lines that represent oversold conditions(70) and indicator values are rising    = -1
// RSI indicator > lines that represent overbought conditions(30) and indicator values are falling = +1
calc_rsi_index(len, src, res) => 
    up         = rma(max(change(src), 0), len)
    down       = rma(-min(change(src), 0), len)
    rsi        = down == 0 ? 100 : up == 0 ? 0 : 100 - (100 / (1 + up / down))
    rsi_res    = request.security(syminfo.tickerid, res, rsi)
    rsi_change = rsi_res - rsi_res[1]
    rsi_index  = 0
    if( rsi_res > 70 and rsi_change < 0 )
        rsi_index := -1
    if( rsi_res < 30 and rsi_change > 0  )
        rsi_index := 1 
    rsi_index
    
// STOCH indicator – main line < lower band (20) and main line crosses the signal line from bottom-up
// STOCH indicato  – main line > upper band (80) and main line crosses the signal line from above-down
calc_stoch_index(len_k, len_d, smoothK, res) => 
    stoch_k     = sma(stoch(close, high, low, len_k), smoothK)
    stoch_d     = sma(stoch_k, len_d)
    res_stoch_k = request.security(syminfo.tickerid, res, stoch_k)
    res_stoch_d = request.security(syminfo.tickerid, res, stoch_d)
    spread      = (res_stoch_k/res_stoch_d -1)*100
    stoch_index = 0
    if( res_stoch_k > 80 and spread < 0 )
        stoch_index := -1
    if( res_stoch_k < 20 and spread > 0  )
        stoch_index := 1
    stoch_index
    
// CCI indicator – indicator < oversold level (-100) and reversed upwards
// CCI indicator – indicator > overbought level (100) and reversed downwards
calc_cci_index(len, src, res) => 
    cci_ma     = sma(src, len)
    cci        = (src - cci_ma) / (0.015 * dev(src, len))
    cci_res    = request.security(syminfo.tickerid, res, cci)
    cci_change = cci_res - cci_res[1]
    cci_index  = 0
    if( cci_res > 100 and cci_change > 0 )
        cci_index := -1
    if( cci_res < -100 and cci_change < 0  )
        cci_index := 1
    cci_index  

//AWESOME OSCILLATOR – saucer and values are greater than 0 or zero line cross from bottom-up - BUY
//AWESOME OSCILLATOR – saucer and values are lower than 0 or zero line cross from above-down  - SELL    
calc_awesome_index(src, res) =>
    ao        = sma(hl2,5) - sma(hl2,34)
    ao_res    = request.security(syminfo.tickerid, res, ao)
    ao_change = ao_res - ao_res[1]
    ao_index  = 0
    if( ao_res > 0 and ao_change > 0 )
        ao_index := 1
    if( ao_res < 0 and ao_change < 0 )
        ao_index := -1
    ao_index 

// Momentum indicator - indicator values are rising  - BUY
// Momentum indicator - indicator values are falling - SELL
calc_momentum_index(len, src, res) => 
    mom       = src - src[len]
    res_mom   = request.security(syminfo.tickerid, res, mom)
    mom_index = 0
    if res_mom>= 0
        mom_index := 1
    if res_mom <= 0
        mom_index := -1
    mom_index 

// MACD - main line values > signal line values  - BUY
// MACD - main line values < signal line values - SELL
calc_macd_index(macd_fast, macd_slow, src, res) => 
    macd       = ema(src, macd_fast) - ema(src, macd_slow)
    res_macd   = request.security(syminfo.tickerid, res, macd)
    macd_index = 0
    if res_macd>= 0
        macd_index := 1
    if res_macd <= 0
        macd_index := -1
    macd_index  

//STOCHRSI - main line < lower band (20) and main line crosses the signal line from bottom-up
//STOCHRSI - main line > upper band (80) and main line crosses the signal line from above-down
calc_stochrsi_index(len_rsi, len_stoch, smoothK, smoothD, src, res) =>
    rsi     = rsi(src, len_rsi)
    stoch_k = sma(stoch(rsi, rsi, rsi, len_stoch), smoothK)
    stoch_d = sma(stoch_k, smoothD)
    res_stoch_k = request.security(syminfo.tickerid, res, stoch_k)
    res_stoch_d = request.security(syminfo.tickerid, res, stoch_d)
    spread  = (res_stoch_k/res_stoch_d -1)*100
    stochrsi_index = 0
    if( res_stoch_k > 80 and spread < 0 )
        stochrsi_index := -1
    if( res_stoch_k < 20 and spread > 0  )
        stochrsi_index := 1
    stochrsi_index 

//Williams % Range  - line is above -20 and values are dropping - Overbough conditions - SELL 
//Williams % Range  - line is below -80 and values are rising   - Oversold conditions  - BUY
calc_wpr_index(len, src, res) => 
    wpr_upper = highest(len)
    wpr_lower = lowest(len)
    wpr = 100 * (src - wpr_upper) / (wpr_upper - wpr_lower)
    wpr_res = request.security(syminfo.tickerid, res, wpr)
    wpr_change = wpr_res - wpr_res[1]
    wpr_index = 0
    if( wpr_res < -80 and wpr_change > 0 )
        wpr_index := 1
    if( wpr_res > -20 and wpr_change < 0 )
        wpr_index := -1
    wpr_index

//Ultimate Oscillator - line is above -20 and values are dropping - Overbough conditions - SELL 
//Ultimate Oscillator - line is below -80 and values are rising   - Oversold conditions  - BUY
average(bp, tr_, length) => sum(bp, length) / sum(tr_, length)

calc_uo_index(len7, len14, len28, res) => 
    high_ = max(high, close[1])
    low_ = min(low, close[1])
    bp = close - low_
    tr_ = high_ - low_
    avg7 = average(bp, tr_, len7)
    avg14 = average(bp, tr_, len14)
    avg28 = average(bp, tr_, len28)
    uo = 100 * (4*avg7 + 2*avg14 + avg28)/7
    uo_res = request.security(syminfo.tickerid, res, uo)
    uo_index = 0
    if uo_res >= 70
        uo_index := 1
    if uo_res <= 30
        uo_index := -1
    uo_index   

//Average Directional Index - indicator > 20 and +DI line crossed -DI line from bottom-up
//Average Directional Index - indicator > 20 and +DI line crossed -DI line from above-down
dirmov(len) =>
	up = change(high)
	down = -change(low)
	truerange = rma(tr, len)
	plus = fixnan(100 * rma(up > down and up > 0 ? up : 0, len) / truerange)
	minus = fixnan(100 * rma(down > up and down > 0 ? down : 0, len) / truerange)
	[plus, minus]

adx(dilen, adxlen) => 
	[plus, minus] = dirmov(dilen)
	sum = plus + minus
	adx = 100 * rma(abs(plus - minus) / (sum == 0 ? 1 : sum), adxlen)

adxHigh(dilen, adxlen) => 
	[plus, minus] = dirmov(dilen)
	plus
	
adxLow(dilen, adxlen) => 
	[plus, minus] = dirmov(dilen)
	minus

calc_adx_index(res) => 
    sig         = adx(dilen, adxlen) //ADX
    sigHigh     = adxHigh(dilen, adxlen) // DI+
    sigLow      = adxLow(dilen, adxlen) // DI-
    res_sig     = request.security(syminfo.tickerid, res, sig)
    res_sigHigh = request.security(syminfo.tickerid, res, sigHigh)
    res_sigLow  = request.security(syminfo.tickerid, res, sigLow)    
    spread      = (res_sigHigh/res_sigLow  -1)*100
    adx_index   = 0
    if res_sig >= 20 and spread > 0
        adx_index := 1
    if res_sig >= 20 and spread < 0
        adx_index := -1
    adx_index

//Bull Bear Power Index - bear power is below 0 and is weakening -> BUY
//Bull Bear Power Index - bull power is above 0 and is weakening -> SELL
calc_bbp_index(len, src, res ) =>
    ema   = ema(src, len)
    bulls = high - ema
    bears = low  - ema
    bulls_res = request.security(syminfo.tickerid, res, bulls)
    bears_res = request.security(syminfo.tickerid, res, bears)
    sum = bulls_res + bears_res
    bbp_index = 0
    if bears_res < 0 and bears_res > bears_res[1]
        bbp_index := 1
    if bulls_res > 0 and bulls_res < bulls_res[1]
        bbp_index := -1
    bbp_index

// --------------------------------MOVING AVERAGES CALCULATION------------------------------------- //
sma10_index  = calc_sma_index(sma10,  src, res)
sma20_index  = calc_sma_index(sma20,  src, res)
sma30_index  = calc_sma_index(sma30,  src, res)
sma50_index  = calc_sma_index(sma50,  src, res)
sma100_index = calc_sma_index(sma100, src, res)
sma200_index = calc_sma_index(sma200, src, res)
ema10_index  = calc_ema_index(ema10,  src, res)
ema20_index  = calc_ema_index(ema20,  src, res)
ema30_index  = calc_ema_index(ema30,  src, res)
ema50_index  = calc_ema_index(ema50,  src, res)
ema100_index = calc_ema_index(ema100, src, res)
ema200_index = calc_ema_index(ema200, src, res)
hull9_index  = calc_ema_index(hma9,   src, res)
vwma20_index = calc_ema_index(vwma20, src, res)

ichimoku_index = 0.0 //Ichimoku - is not active in the calculation brought to you by TV TEAM for the lolz
moving_averages_index = ( ema10_index + ema20_index + ema30_index + ema50_index + ema100_index + ema200_index +
						  sma10_index + sma20_index + sma30_index + sma50_index + sma100_index + sma200_index +
                          ichimoku_index + vwma20_index + hull9_index ) / 15

// -----------------------------------OSCILLATORS CALCULATION----------------------------------------- //
rsi_index       = calc_rsi_index(rsi_len, src, res)
stoch_index     = calc_stoch_index(stoch_k, stoch_d, stoch_smooth, res)
cci_index       = calc_cci_index(cci_len, src, res)
ao_index        = calc_awesome_index(src, res)
mom_index       = calc_momentum_index(momentum_len, src, res)
macd_index      = calc_macd_index(macd_fast, macd_slow, src, res)
stochrsi_index  = calc_stochrsi_index(rsi_len, stoch_k, stoch_d, stoch_smooth, src, res)
wpr_index       = calc_wpr_index(wpr_length, src, res)
uo_index        = calc_uo_index(uo_length7, uo_length14, uo_length28, res)
adx_index       = calc_adx_index(res)
bbp_index       = calc_bbp_index(bbp_len , src, res)

oscillators_index = ( rsi_index + stoch_index + adx_index + cci_index + stochrsi_index + ao_index + mom_index + macd_index + wpr_index + uo_index + bbp_index )	/ 11   

rating_index = ( moving_averages_index + oscillators_index ) / 2

plot(moving_averages_index, color=green, linewidth = 1, title="Moving Averages Rating",transp = 70)
plot(oscillators_index    , color=blue,  linewidth = 1, title="Oscillators Rating",transp = 70)
plot(rating_index         , color=orange,   linewidth = 2, title="Rating")

strongbuy       = hline(1,   "Strong Buy" , color=silver ) 
buy             = hline(0.5, "Strong Buy" , color=green  )
normal          = hline(0,   "Buy/Sell"   , color=silver )
sell            = hline(-0.5,"Strong Sell", color=red    )
strongsell      = hline(-1,  "Strong Sell", color=silver )

fill(strongbuy,buy,   color=green,   transp=90)
fill(buy,normal,      color=#b2ffb2, transp=90)
fill(sell,normal,     color=#F08080, transp=90)
fill(strongsell,sell, color=red,     transp=90)

longCondition = rating_index > 0
if (longCondition)
    strategy.entry("My Long Entry Id", strategy.long)

shortCondition = rating_index < 0
if (shortCondition)
    strategy.entry("My Short Entry Id", strategy.short)