Strategi Breakout Trailing Stop V2

Gambaran keseluruhan
Strategi ini menggabungkan kelebihan strategi penembusan dan strategi pengesanan trend untuk menangkap isyarat penembusan rintangan sokongan dalam grafik garisan panjang, dan menggunakan purata bergerak untuk mengesan kerugian, mencapai keuntungan dalam arah trend garisan panjang, dan mengawal risiko.
Prinsip Strategi
-
Strategi pertama adalah mengira purata bergerak untuk pelbagai set parameter yang berbeza, yang digunakan sebagai penilaian trend, sokongan rintangan, dan pengesanan hentian.
-
Kemudian carilah titik tertinggi dan terendah dalam tempoh yang ditetapkan sebagai kawasan rintangan sokongan untuk masuk. Apabila harga menembusi rintangan sokongan ini, isyarat akan dihasilkan.
-
Strategi membeli untuk membuat lebih banyak isyarat dengan menembusi titik tertinggi, dan menjual untuk menembusi titik terendah dengan membuat isyarat kosong.
-
Selepas masuk, ia akan memegang kedudukan dengan titik terendah titik terendah titik terendah titik terendah titik terendah titik terendah titik terendah titik terendah titik terendah.
-
Apabila kedudukan masuk ke dalam keadaan yang menguntungkan, titik hentian akan ditukarkan kepada mengikut purata bergerak. Apabila harga jatuh di bawah purata bergerak, titik hentian akan ditetapkan sebagai titik terendah pada akar K.
-
Dengan cara ini, anda boleh mengunci keuntungan dan memberi ruang kepada kedudukan anda untuk mengikuti trend.
-
Strategi ini juga memasukkan rata-rata pergerakan sebenar untuk memastikan hanya membeli-belah dalam julat yang sesuai dan mengelakkan penembusan yang berlebihan.
Analisis kelebihan strategi
-
Kaedah ini mempunyai dua kelebihan iaitu strategi penembusan dan strategi penangguhan trend.
-
Ia juga boleh digunakan untuk membeli saham yang lebih besar dan meningkatkan peluang keuntungan.
-
Strategi Hentikan Kerosakan melindungi kedudukan dan memberi ruang yang mencukupi kepada kedudukan untuk beroperasi.
-
Menambah penapis kadar turun naik untuk mengelakkan kenaikan yang tidak menguntungkan.
-
Automasi urus niaga, sesuai untuk part time invoice.
-
Boleh disesuaikan untuk operasi garis rata-rata berkala yang berbeza.
-
Fleksibiliti untuk menyesuaikan cara pengesanan Hentikan Kerosakan.
Analisis risiko strategi
-
Strategi penembusan mudah menimbulkan risiko penembusan palsu. Pengesahan penembusan boleh dikurangkan dengan sewajarnya.
-
Ia memerlukan gelombang yang mencukupi untuk menghasilkan isyarat penembusan, yang mudah tidak berkesan dalam keadaan terbalik.
-
Sebahagian daripada penembusan mungkin terlalu singkat untuk ditangkap. Anda boleh menurunkan garis masa untuk mencari peluang yang lebih banyak.
-
Tracking stop loss mungkin terlalu kerap berhenti dalam keadaan gegaran. Jarak stop loss boleh dikurangkan dengan sewajarnya.
-
Penapisan kadar lonjakan mungkin terlepas beberapa peluang. Anda boleh menurunkan parameter penapisan.
Arah pengoptimuman strategi
-
Uji kombinasi parameter garis rata yang berbeza untuk mencari parameter terbaik.
-
Uji mekanisme pengesahan penembusan yang berbeza, seperti saluran, bentuk K-line, dan sebagainya.
-
Cubalah pelbagai cara untuk mengesan hentian dan cari hentian terbaik.
-
Mengoptimumkan strategi pengurusan wang, seperti skor positron.
-
Menambah penapis indikator teknikal statistik untuk meningkatkan ketepatan penapisan.
-
Kaedah ini diuji dengan pelbagai varieti.
-
Menggabungkan algoritma pembelajaran mesin untuk meningkatkan kesan strategi.
ringkaskan
Strategi ini mengintegrasikan pemikiran terobosan dan pemikiran terhenti trend, dengan asumsi bahawa penghakiman garis panjang betul, dapat mengoptimumkan ruang keuntungan. Kuncinya adalah untuk mencari kombinasi parameter yang terbaik, dan bekerjasama dengan strategi pengurusan wang yang baik, untuk merebut peluang garis panjang sambil mewujudkan risiko yang terkawal.
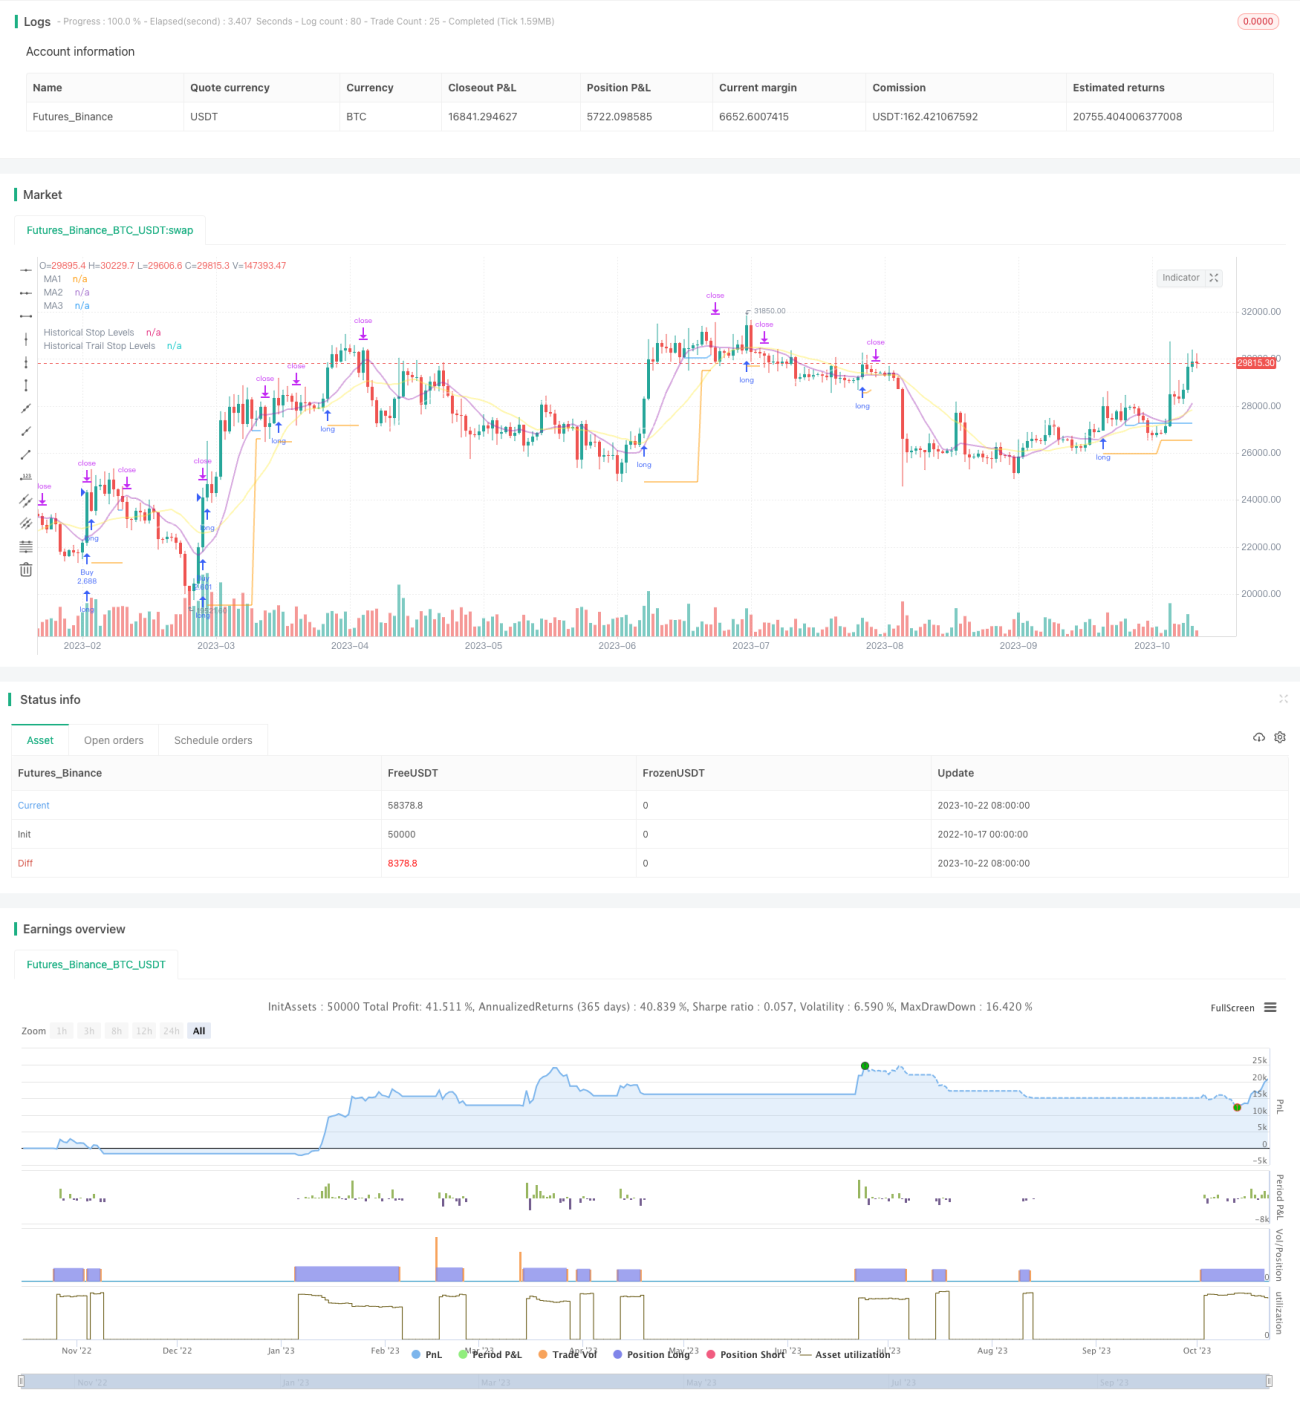
/*backtest
start: 2022-10-17 00:00:00
end: 2023-10-23 00:00:00
period: 1d
basePeriod: 1h
exchanges: [{"eid":"Futures_Binance","currency":"BTC_USDT"}]
*/

// This source code is subject to the terms of the Mozilla Public License 2.0 at https://mozilla.org/MPL/2.0/
// © millerrh

// The intent of this strategy is to buy breakouts with a tight stop on smaller timeframes in the direction of the longer term trend.- 1