Strategi Lantunan Semula Titik Rendah Pembalikan

[trans]
Gambaran Keseluruhan
Strategi Pemulihan Titik Rendah adalah strategi dagangan saham yang mudah dan berkesan. Ia menangkap peluang pemulihan pada titik rendah, memasuki pasaran apabila harga saham berbalik menaik, menggunakan operasi jangka pendek, dan keluar dengan cepat selepas memperoleh keuntungan melalui henti rugi.
Prinsip Strategi
Strategi ini terutamanya berdasarkan dua penunjuk: harga terendah 5 hari untuk menentukan masa masuk, dan RSI 2 hari untuk menentukan masa keluar.
Prosedur operasi khusus adalah seperti berikut:
-
Jika harga tutup hari ini lebih rendah daripada harga terendah 5 hari semalam, maka lakukan posisi beli pada harga tutup.
-
Jika RSI 2 hari ditutup di atas zon terlebih beli (lalai 50), maka tutup posisi pada harga tutup hari tersebut untuk mengambil untung.
-
Jika tiada syarat ambil untung dicetuskan dalam masa 5 hari selepas masuk, keluar secara paksa dengan henti rugi.
Dengan cara ini, kita masuk ke pasaran berhampiran titik penting apabila harga saham berada pada fasa pemulihan menaik, mengunci keuntungan melalui isyarat RSI terlebih beli, dan menetapkan had masa henti rugi untuk mengawal risiko.
Analisis Kelebihan
Strategi ini mempunyai kelebihan berikut:
-
Mudah dilaksanakan. Hanya perlu memerhatikan dua penunjuk, peraturan yang jelas, dan boleh membuat keputusan dagangan dengan cepat.
-
Menggunakan pendekatan pembalikan arah aliran, masuk sebelum harga saham berbalik menaik untuk menangkap pergerakan besar.
-
Menetapkan titik ambil untung dan henti rugi untuk mengawal kerugian tunggal dan mencapai keuntungan yang stabil.
-
Pusing ganti modal yang cepat, tidak perlu menunggu lama, dan boleh melakukan pelbagai dagangan secara berulang.
-
Boleh digunakan secara meluas untuk kebanyakan saham, terutamanya saham yang mempunyai ciri pembalikan harga rendah jangka pendek yang jelas.
Analisis Risiko
Strategi ini juga mempunyai beberapa risiko:
-
Masa pembalikan yang salah mungkin menyebabkan kerugian. Menilai masa pembalikan memerlukan pengalaman praktikal.
-
Penetapan titik henti rugi yang tidak sesuai boleh memperbesar kerugian. Perlu mempertimbangkan julat henti rugi yang munasabah.
-
Turun naik pasaran yang tinggi mungkin menyukarkan titik ambil untung dicetuskan. Parameter RSI boleh diselaraskan.
-
Hanya sesuai untuk dagangan jangka pendek, tidak sesuai untuk pegangan jangka panjang.
-
Kekerapan pusing ganti yang tinggi meningkatkan kos dagangan dan kos gelinciran.
Hala Tuju Pengoptimuman
Strategi ini boleh dioptimumkan lagi dari aspek berikut:
-
Menggabungkan penunjuk arah aliran untuk mengelakkan dagangan bertentangan arah aliran. Contohnya MACD, KDJ, dll.
-
Menguji parameter bilangan hari yang berbeza untuk harga terendah, mencari penunjuk pengesahan pembalikan yang lebih sesuai.
-
Menguji saiz parameter RSI untuk mengoptimumkan syarat ambil untung.
-
Mempertimbangkan menambah modul pengoptimuman henti rugi, menggunakan ATR untuk menetapkan titik henti rugi secara dinamik.
-
Mengoptimumkan masa masuk, boleh menunggu selepas pengesahan pembalikan untuk memasuki pasaran, menapis penembusan palsu.
-
Selepas mempertimbangkan kos dagangan, tetapkan sasaran ambil untung yang munasabah. Kawal kekerapan dagangan.
Kesimpulan
Strategi Pemulihan Titik Rendah adalah strategi dagangan jangka pendek yang tipikal. Ia merebut peluang dagangan pemulihan pada titik rendah, menggunakan gabungan penunjuk mudah untuk menentukan masa masuk dan masa keluar, dan mencapai ambil untung serta henti rugi dengan cepat. Berbanding dengan beli dan pegang, strategi ini mempunyai kelebihan nisbah risiko-pulangan yang lebih tinggi. Dengan pengoptimuman parameter dan peraturan secara berterusan, strategi ini boleh menyesuaikan diri dengan ciri kebanyakan saham dan menjana keuntungan yang stabil. Walau bagaimanapun, perlu berhati-hati dengan masalah kos dagangan yang disebabkan oleh frekuensi dagangan yang berlebihan. Secara keseluruhannya, Strategi Pemulihan Titik Rendah adalah strategi dagangan saham yang mudah, praktikal dan berkesan untuk menjana keuntungan.
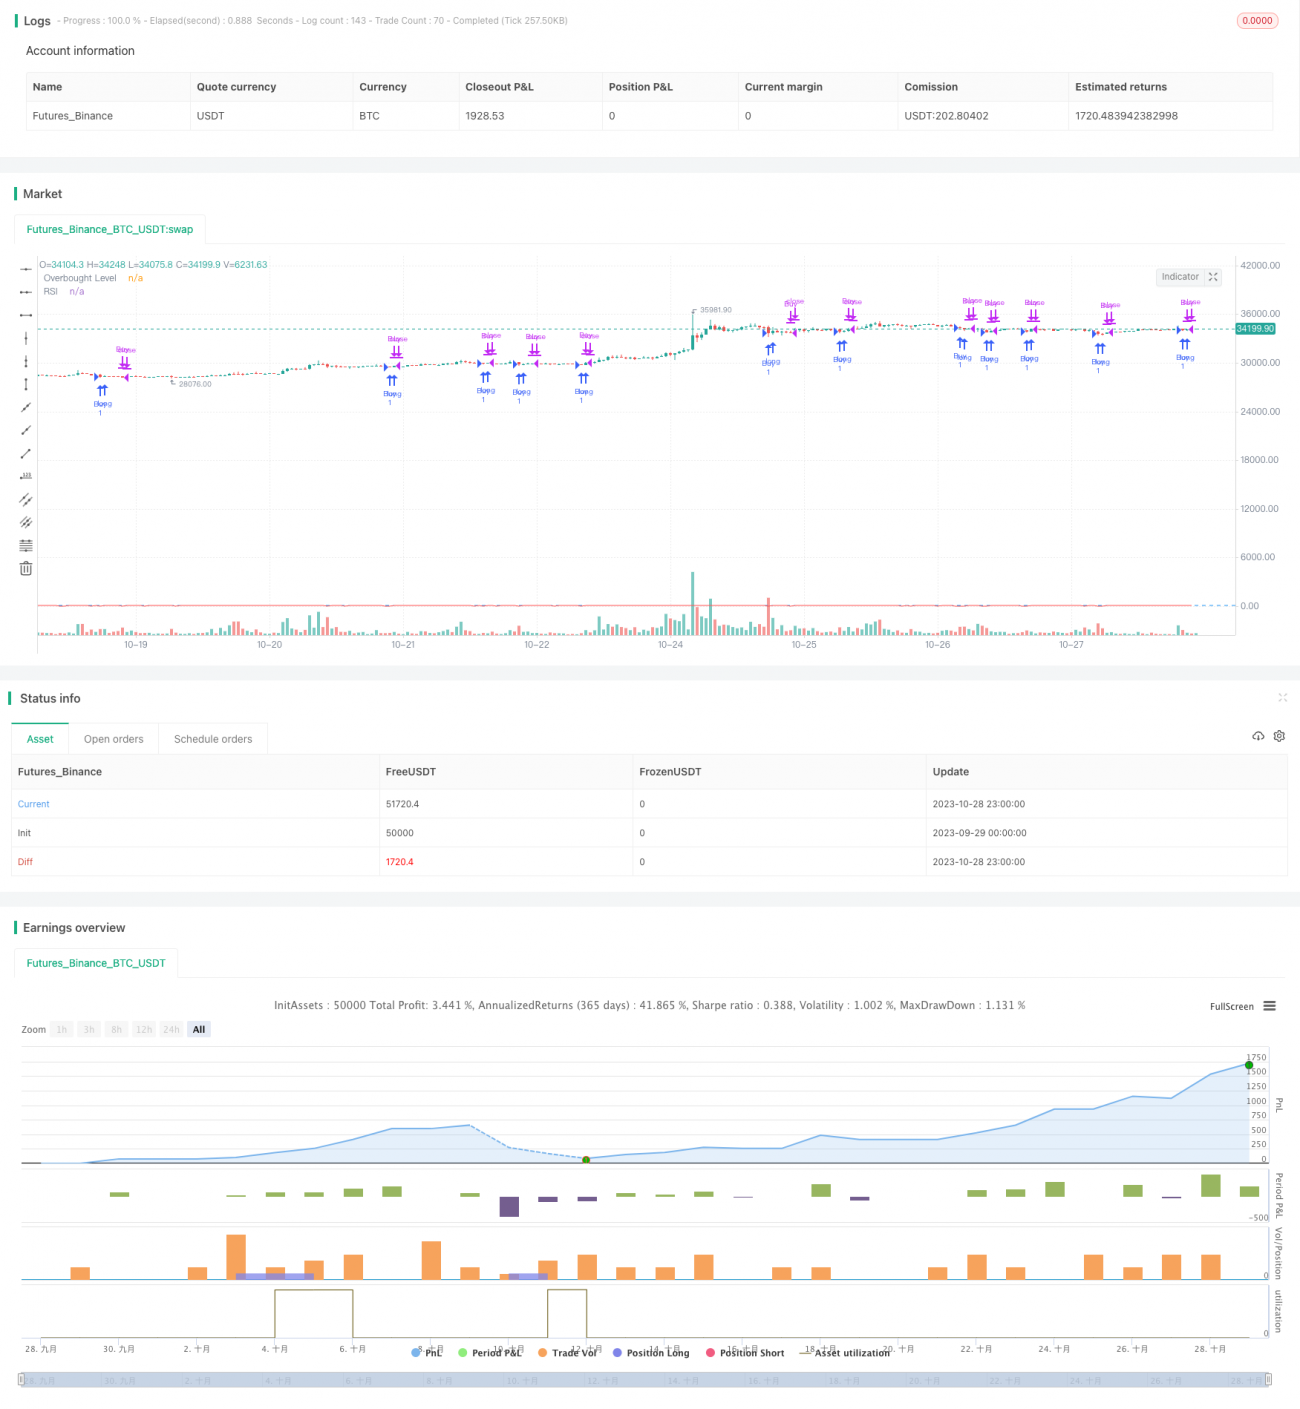
/*backtest
start: 2023-09-29 00:00:00
end: 2023-10-29 00:00:00
period: 1h
basePeriod: 15m
exchanges: [{"eid":"Futures_Binance","currency":"BTC_USDT"}]
*/

// This source code is subject to the terms of the Mozilla Public License 2.0 at https://mozilla.org/MPL/2.0/
// © hobbiecode

// If today’s close is below yesterday’s five-day low, go long at the close.- 1