Strategi Perdagangan Automatik Panjang-Pendek RSI

Gambaran keseluruhan
Strategi ini merancang satu sistem perdagangan automatik yang lebih terbuka berdasarkan indeks yang agak kuat (RSI). Ia boleh mengeluarkan isyarat yang lebih terbuka secara automatik untuk perdagangan automatik apabila RSI mencapai kawasan overbought dan oversold.
Prinsip Strategi
Strategi ini menghasilkan nilai RSI dalam julat 0-100 dengan mengira kenaikan dan penurunan saham dalam tempoh tertentu. Apabila RSI berada di bawah 30, ia adalah keadaan jual beli, dan apabila ia berada di atas 70, ia adalah keadaan beli beli.
Khususnya, strategi pertama mengira nilai RSI 15 kitaran. Apabila RSI turun ke bawah 20, dianggap sebagai keadaan oversold, ketika itu masuk ke atas 200 hari pergerakan rata-rata. Apabila RSI naik ke lebih dari 80, dianggap sebagai keadaan overbuy, ketika itu masuk ke dalam kosong.
Selain itu, strategi ini juga menggambarkan garis tanda dan label yang berkaitan dengan isyarat harga, menjadikan isyarat perdagangan lebih intuitif.
Kelebihan Strategik
- Strategi yang jelas, mudah difahami dan dilaksanakan
- Pengukuran yang tepat untuk overbought dan oversold berdasarkan RSI
- Perdagangan automatik tanpa campur tangan manusia
- Tetapkan Stop Loss, mengawal risiko dengan berkesan
- Isyarat perdagangan intuitif dan mudah dipantau
Risiko Strategik
- RSI mempunyai ketidakselesaan yang boleh menyebabkan kesalahan penilaian
- Tahap yang ditetapkan tidak berlaku untuk semua varieti
- Penetapan titik henti yang tidak betul boleh menyebabkan kerugian yang lebih besar
- Peningkatan harga saham boleh menyebabkan kerugian
Langkah-langkah kawalan risiko termasuk: mengoptimumkan parameter RSI, menyesuaikan nilai terhad overbought dan oversold untuk pelbagai jenis, menetapkan titik hentian yang munasabah, dan mengelakkan perdagangan yang bertentangan dengan indikator trend.
Arah pengoptimuman strategi
- Mengoptimumkan parameter RSI untuk meningkatkan ketepatan penilaian overbought dan oversold
- Sinyal pengesahan dagangan yang digabungkan dengan petunjuk lain, seperti KDJ, MACD dan sebagainya
- Pengaturan untuk mengoptimumkan titik henti mengikut keadaan pasaran
- Meningkatkan penilaian trend dan mengelakkan operasi berlawanan arah
- Menetapkan kurva kepentingan untuk menjejaki henti rugi
- Membangunkan modul kawalan angin untuk mengawal risiko tunggal dan keseluruhan
ringkaskan
Strategi overall adalah strategi perdagangan automatik yang menggunakan RSI untuk menilai overbought dan oversold. Ia menghantar isyarat perdagangan apabila RSI mencapai kawasan melampau overbought dan oversold, dan boleh melakukan operasi membeli dan menjual secara automatik. Strategi ini mudah difahami, mudah dilaksanakan, dan sesuai sebagai strategi asas perdagangan automatik.
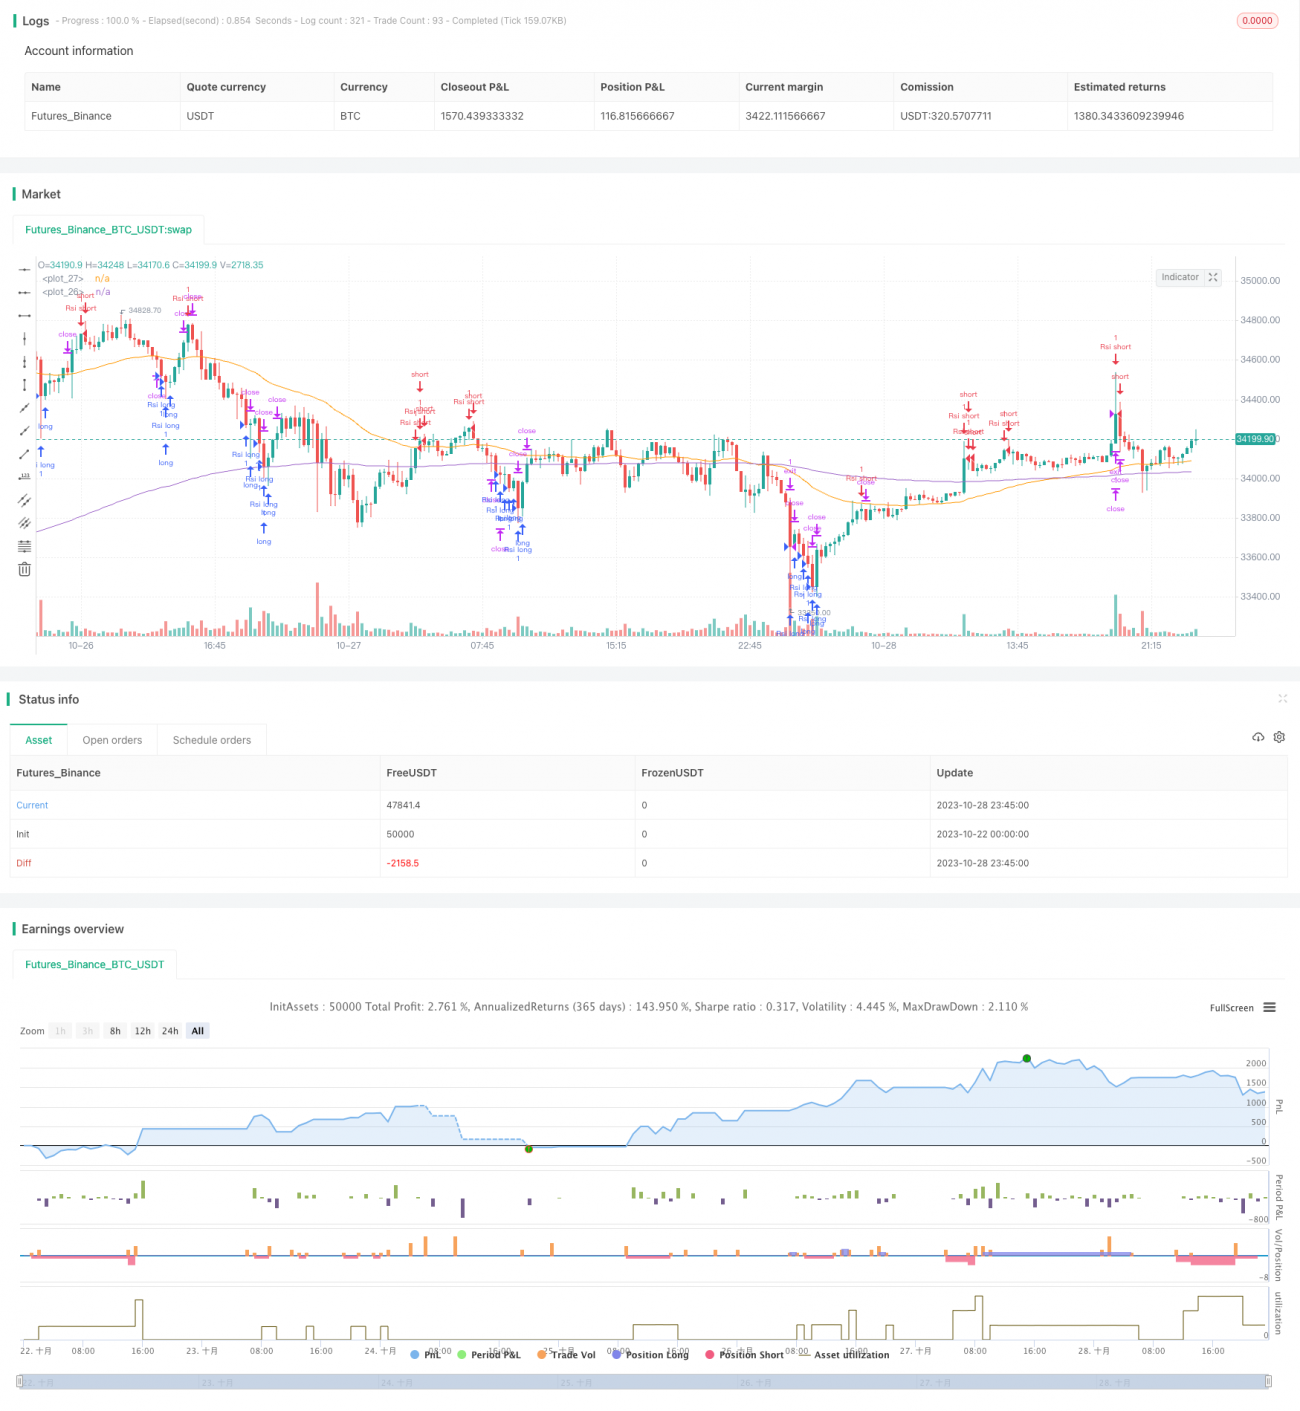
/*backtest
start: 2023-10-22 00:00:00
end: 2023-10-29 00:00:00
period: 15m
basePeriod: 5m
exchanges: [{"eid":"Futures_Binance","currency":"BTC_USDT"}]
*/

//@version=5
strategy("RSI Improved strategy", overlay=true)
higherTF1 = input.timeframe('15' , "Resolution", options = ['5', '15', '1H', 'D', 'W', 'M'])
dailyopen = request.security(syminfo.tickerid, higherTF1, close)- 1