Strategi pembalikan arah aliran berasaskan Bollinger Bands


Tarikh penciptaan: 2023-11-01 11:29:34 Akhirnya diubah suai: 2023-11-01 11:29:34
Salin: 0 Bilangan klik: 702
1
fokus pada
1617
Pengikut

Strategi pembalikan arah aliran berasaskan Bollinger Bands

Gambaran keseluruhan

Strategi ini berdasarkan pada indikator Bollinger Bands dan Moving Averages, menentukan sama ada harga mendekati Bollinger Bands dan mengambil posisi long atau pendek ketika harga mendekati Bollinger Bands dan mendapat keuntungan. Ia adalah strategi yang lebih baik untuk mendapatkan keuntungan apabila harga melanggar Bollinger Bands dan lebih banyak apabila harga melanggar Bollinger Bands.

Prinsip

Strategi ini memberi tumpuan kepada dua isyarat masuk:

  1. Isyarat berbilang kepala: apabila harga penutupan menyentuh rel bawah, dan harga penutupan adalah lebih tinggi daripada garis rata-rata EMA, entiti garis K terdahulu adalah negatif, entiti garis K semasa adalah positif.

  2. isyarat kosong: apabila harga tutup menyentuh atas, dan harga tutup adalah di bawah garis rata-rata EMA, entiti garis K terdahulu adalah garis yang baik, entiti garis K semasa adalah garis yang buruk.

Stop loss: Stop loss tetap. Titik stop loss adalah faktor risiko pulangan beberapa kali ganda dari harga masuk ke jarak laluan lawan.

Cara penangguhan: Matlamat adalah untuk mendapatkan kemenangan untuk pihak lawan. Iaitu melakukan penangguhan ganda sebagai bawah, dan melakukan penangguhan kosong sebagai atas.

Kelebihan

  1. Menggabungkan kelebihan trend dan strategi pembalikan, ia lebih baik dalam keadaan goyah trend.

  2. Menggunakan Indeks Bollinger Bands untuk mengenalpasti kawasan overbought dan oversold, untuk menentukan peluang untuk berbalik.

  3. Titik Hentian Tetap ditetapkan secara munasabah untuk membantu mengawal risiko.

  4. Cara untuk memaksimumkan keuntungan dengan cara bergerak.

Risiko

  1. Strategi penembusan mudah didera dan perlu berhati-hati dengan penembusan palsu.

  2. Stop loss mungkin sering dicetuskan apabila keadaan terlalu bergolak.

  3. Hentian tetap tidak dapat disesuaikan dengan turun naik pasaran dan mungkin terlalu longgar atau terlalu radikal.

  4. Jika anda tidak menetapkan parameter pada masa yang tepat, ia mungkin kurang berkesan.

Optimum idea

  1. Anda boleh mempertimbangkan untuk menapis isyarat masuk dengan penunjuk RSI gabungan, seperti RSI lebih tinggi daripada 50 dan RSI lebih rendah daripada 50 dan kosong, untuk mengelakkan isyarat salah.

  2. Tambah fungsi untuk menyesuaikan jarak hentian tetap secara automatik, menjadikan hentian lebih fleksibel. Sebagai contoh, set jarak hentian secara dinamik mengikut petunjuk ATR.

  3. Mengoptimumkan parameter Brin untuk mencari kombinasi parameter terbaik.

  4. Anda boleh menguji parameter garis rata EMA yang berbeza untuk mengoptimumkan kesan pagar pagar pada garis rata.

ringkaskan

Strategi ini mempertimbangkan trend dan pembalikan secara menyeluruh, menggunakan Brinband untuk menentukan tempat masuk yang lebih baik, memaksimumkan keuntungan dengan menghentikan pergerakan. Ia berfungsi dengan baik dalam keadaan goyah trend. Tetapi perlu berhati-hati untuk mengelakkan fenomena terhalang, sambil menyesuaikan parameter untuk mengoptimumkan kesan strategi.
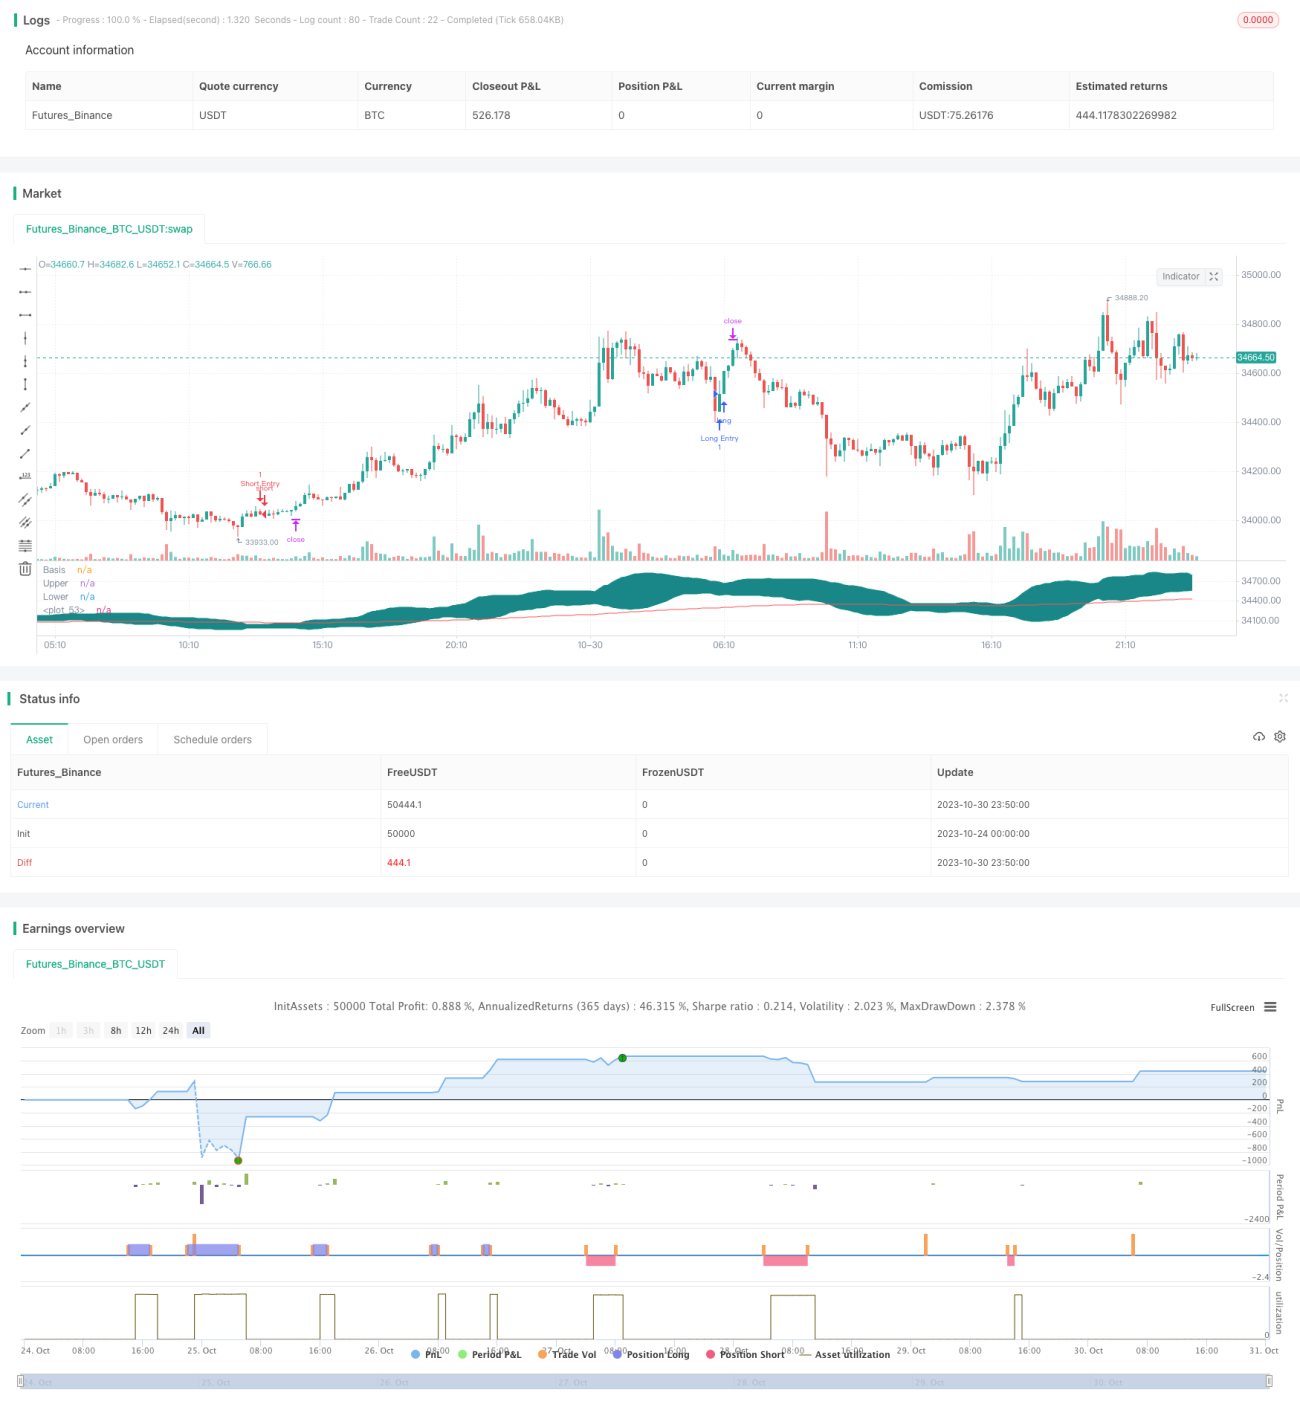
Kod sumber strategi
/*backtest
start: 2023-10-24 00:00:00
end: 2023-10-31 00:00:00
period: 10m
basePeriod: 1m
exchanges: [{"eid":"Futures_Binance","currency":"BTC_USDT"}]
*/

//@version=4

// Welcome to yet another script. This script was a lot easier since I was stuck for so long on the Donchian Channels one and learned so much from that one that I could use in this one
// This code should be a lot cleaner compared to the Donchian Channels, but we'll leave that up to the pro's
// This strategy has two entry signals, long = when price hits lower band, while above EMA, previous candle was bearish and current candle is bullish
// Short = when price hits upper band, while below EMA, previous candle was bullish and current candle is bearish
// Take profits are the opposite side's band(lower band for long signals, upper band for short signals). This means our take profit price will change per bar
// Our stop loss doesn't change, it's the difference between entry price and the take profit target divided by the input risk reward
// At the time of writing this, I could probably calculate that much easier by simply multiplying the opposite band by the input risk reward ratio
// Since I want to get this script out and working on the next one, I won't clean that up, I'm sorry
// strategy(shorttitle="BB Trending Reverse Strategy", title="Bollinger Bands Trending Reverse Strategy", overlay=true, default_qty_type = strategy.cash, default_qty_value = 150, initial_capital = 1000, currency = currency.USD, commission_type = "percent", commission_value = 0.036)

// The built-in Bollinger Band indicator inputs and variables, added some inputs of my own and organised the code
length              = input(20, minval=1)
src                 = input(close, title="Source")
mult                = input(2.0, minval=0.001, maxval=50, title="StdDev")
emaInput            = input(title = "EMA Input", type = input.integer, defval = 200, minval = 10, maxval = 400, step = 1)
riskreward          = input(title = "Risk/Reward Ratio", type = input.float, defval = 1.50, minval = 0.01, maxval = 100, step = 0.01)
offset              = input(0, "Offset", type = input.integer, minval = -500, maxval = 500)
basis               = sma(src, length)
dev                 = mult * stdev(src, length)
upper               = basis + dev
lower               = basis - dev
ema                 = ema(close, emaInput)

// These are our conditions as explained above
entryLong           = low[1] <= lower[1] and low <= lower and low > ema
entryShort          = high[1] >= upper[1] and high >= upper and high < ema
reversecandleLong   = close > open and close[1] < open[1]
reversecandleShort  = close < open and close[1] > open[1]
var stopLong        = 0.0
var stopShort       = 0.0

// These are our entry signals, notice how the stop condition is within the if statement while the strategy.exit is outside of the if statement, this way the take profit targets trails up or down depending on what the price does
if reversecandleLong and entryLong and strategy.position_size == 0
    stopLong := (((close / upper - 1) * riskreward + 1) * close)
    strategy.entry("Long Entry", strategy.long, comment = "Long Entry")
    
strategy.exit("Exit Long", "Long Entry", limit = upper, stop = stopLong, comment = "Exit Long")

if reversecandleShort and entryShort and strategy.position_size == 0
    stopShort := (((close / lower - 1) / riskreward + 1) * close)
    strategy.entry("Short Entry", strategy.short, comment = "Short Entry")

strategy.exit("Exit Short", "Short Entry", limit = lower, stop = stopShort, comment = "Exit Short")


// The built-in Bollinger Band plots
plot(basis, "Basis", color=#872323, offset = offset)
p1 = plot(upper, "Upper", color=color.teal, offset = offset)
p2 = plot(lower, "Lower", color=color.teal, offset = offset)
fill(p1, p2, title = "Background", color=#198787, transp=95)
plot(ema, color=color.red)

// These plots are to check the stoplosses, they can  make a mess of your chart so only use these if you want to make sure these work
// plot(stopLong)
// plot(stopShort)