Strategi Mengikuti Aliran Jalur Bollinger Purata Pergerakan Berganda
Gambaran keseluruhan
Strategi ini berdasarkan pada garis rataan ganda Brin untuk membuat keputusan perdagangan mengikut trend. Ia menggunakan perkongsian dan penyebaran Brin ke bawah untuk menilai perubahan trend, membeli di dekat Brin ke bawah, menjual di dekat atas, membeli rendah dan menjual tinggi, dan keluar dengan keuntungan.
Prinsip Strategi
Strategi ini menggunakan kedua-dua versi Brinber yang mudah dan Brinber yang dipertingkatkan.
Blink sederhana menggunakan harga penutupan untuk mengira SMA, dan Blink bertenaga menggunakan harga penutupan untuk mengira EMA.
Kedua-dua orbit atas dan bawah dikira melalui perbezaan piawaian ± N kali ganda di orbit tengah.
Strategi ini menilai trend berdasarkan jarak antara Brin dan down. Apabila spread lebih kecil daripada nilai terendah yang ditetapkan, ia menunjukkan bahawa ia memasuki julat trend dan boleh melakukan perdagangan mengikut trend.
Khususnya, apabila harga hampir turun, anda boleh membeli lebih banyak, dan apabila harga hampir naik, anda boleh menjual posisi kosong. Stop loss adalah peratusan stop loss tetap, dan anda boleh memilih untuk mengaktifkan tracking stop loss.
Target keuntungan bergantung kepada pilihan untuk meletakkan kedudukan kosong di tengah atau di atas landasan.
Strategi ini juga boleh memilih untuk menjual hanya jika ia memastikan keuntungan, untuk mengelakkan kerugian.
Analisis kelebihan
Strategi ini mempunyai kelebihan berikut:
- Penggabungan dua tali pinggang Brin untuk meningkatkan kecekapan keputusan
Penggunaan Brinband mudah dan Brinband yang dipertingkatkan, dapat membandingkan kesan kedua-dua jenis Brinband, memilih versi yang lebih baik, dan meningkatkan kecekapan keputusan.
- Tingkat trend berdasarkan lebar laluan tali pinggang Brin
Apabila saluran Brin berkurangan, ia menandakan bahawa ia memasuki trend, dan ia mempunyai peluang perdagangan yang lebih tinggi untuk mengikuti trend.
- Cara Fleksibel untuk Menghentikan Kerosakan
Menggunakan peratusan berhenti tetap untuk mengawal kerugian tunggal. Anda boleh memilih untuk berhenti di tengah atau di atas landasan, dan mengaktifkan tracking stop untuk mengunci lebih banyak keuntungan.
- Pencegahan kerugian
Jual hanya dengan memastikan keuntungan, untuk mengelakkan kerugian daripada berkembang.
Analisis risiko
Strategi ini juga mempunyai risiko:
- Risiko penarikan balik
Berdagang mengikut trend mempunyai risiko penarikan diri, dan tekanan mental yang diperlukan untuk menanggung kerugian berterusan.
- Risiko Keadaan Bergolak
Apabila laluan Brin adalah lebar, ia menunjukkan bahawa pasaran mungkin masuk ke dalam gegaran, ketika ini strategi ini tidak berfungsi dengan baik dan perlu menghentikan perdagangan untuk menunggu trend terbentuk semula.
- Risiko tercetus
Penutupan peratusan tetap mungkin terlalu radikal dan perlu disesuaikan dengan cara penutupan yang lebih ringan seperti penutupan ATR.
Arah pengoptimuman
Strategi ini boleh dioptimumkan dengan:
- Optimumkan parameter Brin
Anda boleh menguji pelbagai parameter garis rata-rata, perkalian standard perbezaan, dan mencari kombinasi parameter Brin yang lebih sesuai untuk pasaran yang berbeza.
- Penapisan dalam kombinasi dengan penunjuk lain
Ia boleh digunakan untuk menyaring indikator seperti MACD, KD dan lain-lain berdasarkan isyarat Brin, mengurangkan perdagangan di pasaran yang bergolak.
- Mengoptimumkan strategi hentian hentian
Anda boleh menguji pelbagai cara untuk menghentikan kehilangan pergerakan, atau memaksimumkan titik berhenti berdasarkan metrik seperti amplitudo dan ATR.
- Pengurusan wang yang optimum
Mengoptimumkan pengurusan kedudukan untuk setiap urus niaga dan menguji strategi penambahan kedudukan yang berbeza.
ringkaskan
Strategi ini mengintegrasikan keunggulan indikator Brin-Band Ganda, mengikut tahap trend yang ditentukan oleh lebar saluran Brin-Band, untuk melakukan perdagangan pelacakan yang rendah dan tinggi semasa trend. Pada masa yang sama, menetapkan mekanisme penangguhan saintifik untuk mengawal risiko. Strategi ini dapat meningkatkan kestabilan lebih lanjut melalui pengoptimuman parameter dan gabungan penapisan indikator lain.
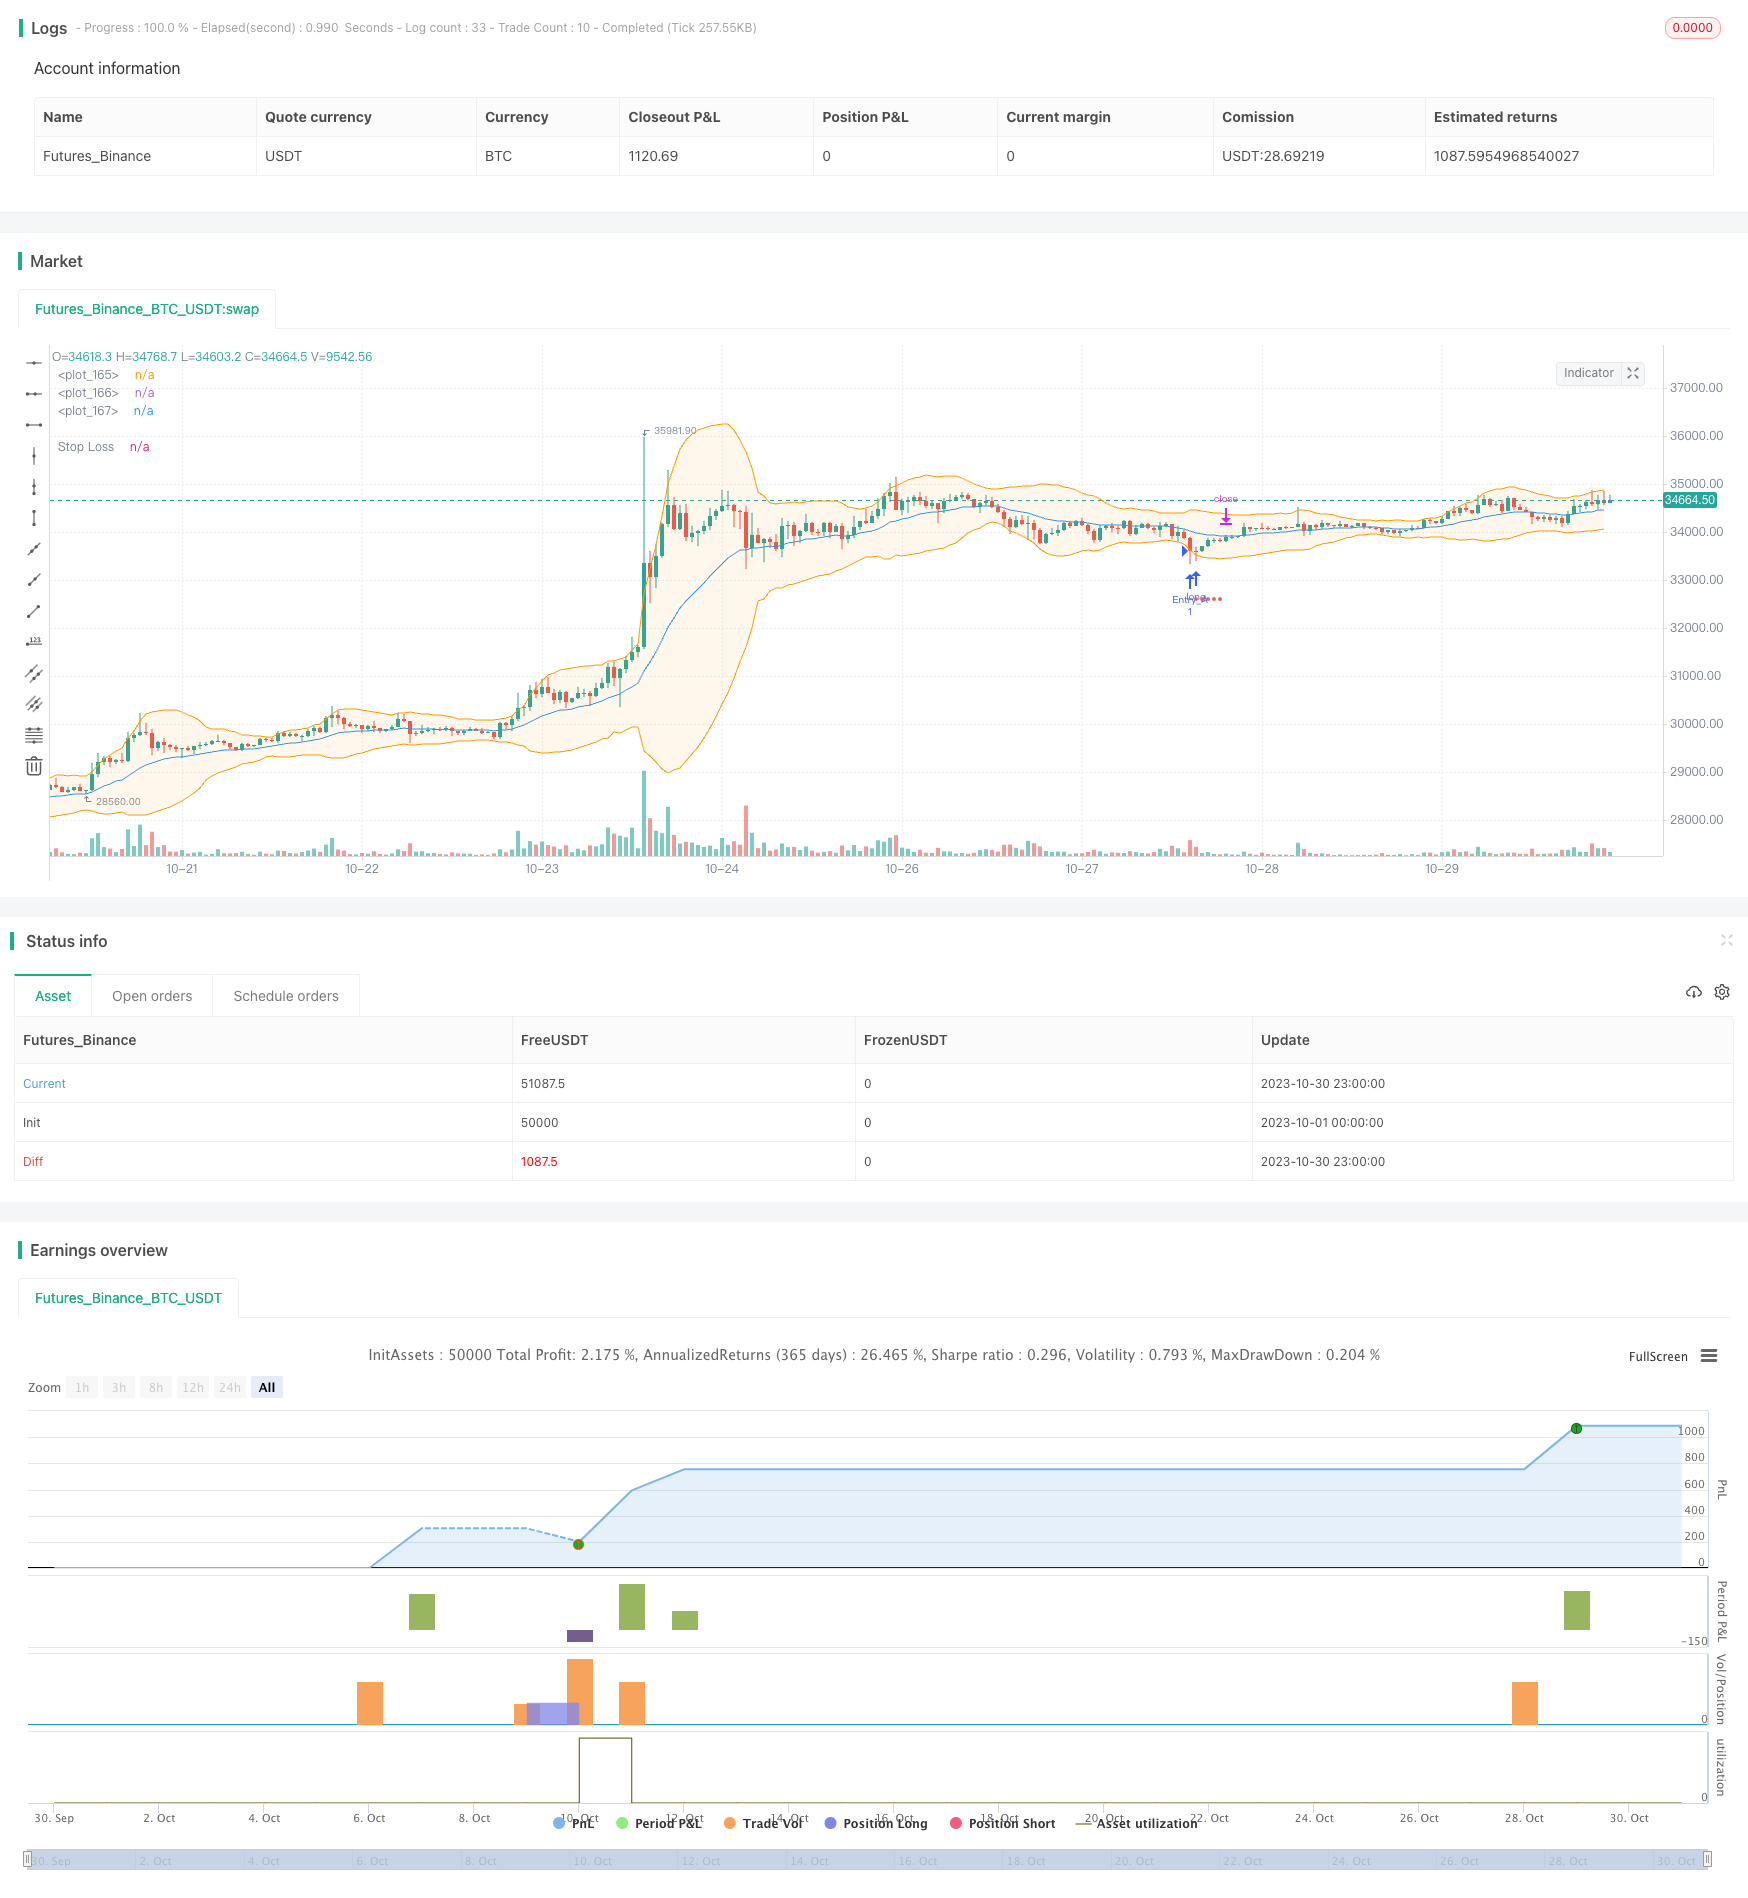
/*backtest
start: 2023-10-01 00:00:00
end: 2023-10-31 00:00:00
period: 1h
basePeriod: 15m
exchanges: [{"eid":"Futures_Binance","currency":"BTC_USDT"}]
*/

// This source code is subject to the terms of the Mozilla Public License 2.0 at https://mozilla.org/MPL/2.0/
// © JCGMarkets

//@version=4
strategy("B.Bands | Augmented | Intra-range | Long-Only", shorttitle = "BB|A|IR|L", initial_capital=5000, commission_value=0.075, slippage = 1, overlay = true)

//Technical Indicators Data
show_simp   = input(false, title="Trade on Simple Bollinger Bands ", type= input.bool, group="Select Strategy System")
show_augm   = input(true, title="Trade on Augmented Bollinger Bands", type= input.bool, group="Select Strategy System")
periods     = input(20, title="Periods for Moving Average", type =input.integer, minval = 2, step = 1, group="Technical Inputs")
std         = input(2, title="Std", type = input.float, minval=0.1 , step = 0.1, group="Technical Inputs")

// Strategy data
max_spread_bb   = input(20000.0, title="Max Spread Tolerance Beetween Bands", type=input.float, step=0.1, group="Strategy Inputs")
entry_source    = input(close, title="Entry data source", type=input.source, group="Strategy Inputs")
exit_source     = input(high, title="Exit data source", type=input.source, group="Strategy Inputs")
take_profit     = input("middle", title = "Profit to band:", options = ["middle", "opposite"], group="Strategy Inputs")
stop_loss       = input(3.00, title="Stop Loss %", type=input.float, step=0.05, group="Strategy Inputs")
trailing        = input(false, title="Activate trailing stop?", type = input.bool, group="Strategy Inputs")
stop_perc       = input(6.00, title="Trailing %", type=input.float, step=0.125, group="Strategy Inputs") * 0.01
sell_profit     = input(false, title="Only sell in profit (Stop Loss still active) ", type= input.bool, group="Strategy Inputs")


var SL = 0.0
var SLT= 0.0


//Simple BB Calculation -> adapt if needed with different std for upper-lower, sma-ema, etc
middle_sim = sma(close, periods)

//Augmented BB Calculation -> adapt if needed with different std for upper lower, etc
middle_augm  = ema(close, periods)
middle_upp = ema(high, periods)
middle_low = ema(low, periods)

//Multiplier
dev      = stdev(close, periods) * std

//Upper & Lower Bands
upper = (middle_sim + dev)
lower = (middle_sim - dev)

//Augmented Bands
upper_augm = (middle_upp + dev)
lower_augm = (middle_low - dev)

//Bands Spread
spread   = upper - lower
spread_augm   = upper_augm - lower_augm

//From date
filter_from    =   input(  true,    title="===> From", group="Date Control")
from_y         =   input(  2010,    title = "from year", group="Date Control")
from_m         =   input(     1,    title = "from month", minval =1, maxval=12, group="Date Control")
from_d         =   input(     1,    title = "from day",  minval=1, maxval=31, group="Date Control")

//To date
filter_to   =    input( true,   title="===> To", group="Date Control")
to_y        =    input( 2030,   title = "To year", group="Date Control")
to_m        =    input(    1,   title = "To month", minval =1, maxval=12, group="Date Control")
to_d        =    input(    1,  title = "To day",  minval=1, maxval=31, group="Date Control")

// Date Condition
In_date() =>  true

in_position = strategy.position_size > 0

// Trailing stop
SLT := if in_position and In_date()
    stop_inicial = entry_source * (1 - stop_perc)
    max(stop_inicial, SLT[1])
else
    0

slts = (low <= SLT) and (trailing == true)


//Essential Trade logics
entry_long = (entry_source <= lower) and (spread < max_spread_bb)
entry_long_augm = (entry_source <= lower_augm) and (spread_augm < max_spread_bb)

// Simple Bollinger Conditions

if (not in_position and show_simp and In_date())
    if entry_long
        // Trigger buy order
        position_size = round( strategy.equity / close ) // All available equity for this strategy example
        strategy.entry("Entry", strategy.long, qty = position_size )
        SL := close * (1 - (stop_loss / 100)) // You could determine wether or not implement stop loss with bool input and if condition here.


if in_position and show_simp and not sell_profit and In_date()
    //Exits if not sell in profit
    if take_profit == "middle"
        strategy.exit("Target", "Entry", limit = middle_sim, stop = SL, comment="Exit")
    if take_profit == "opposite"
        strategy.exit("Target", "Entry", limit = upper, stop = SL, comment="Exit")

if in_position and show_simp and sell_profit and In_date()
    //Exits if sell in profit
    if take_profit == "middle"
        strategy.exit("Target", "Entry", limit = (strategy.openprofit > 0 ? middle_sim: na), stop = SL, comment="Exit")
    if take_profit == "opposite"
        strategy.exit("Target", "Entry", limit = (strategy.openprofit > 0 ? upper: na), stop = SL, comment="Exit")


if in_position and show_simp and slts and In_date()
    //Trailing activation
    strategy.close("Entry", comment="SLT")

if not In_date()
    //Exit due out of date range
    strategy.close("Entry", comment="Out of date range")


// Augmented Bollinger Conditions

if (not in_position and show_augm and In_date())
    if entry_long_augm
        // Trigger buy order
        position_size = round( strategy.equity / close )
        strategy.entry("Entry_A", strategy.long, qty = position_size )
        SL := close * (1 - (stop_loss / 100) )

if in_position and show_augm and not sell_profit and In_date()
    //Exits and not sell in profit
    if take_profit == "middle"
        strategy.exit("Target", "Entry_A", limit = middle_augm, stop = SL, comment="Exit")
    if take_profit == "opposite"
        strategy.exit("Target", "Entry_A", limit = upper_augm, stop = SL, comment="Exit")


if in_position and show_augm and sell_profit and In_date()
    //Exit only in profit
    if take_profit == "middle"
        strategy.exit("Target", "Entry_A", limit = (strategy.openprofit > 0 ? middle_augm:na), stop = SL, comment="Exit")
    if take_profit == "opposite"
        strategy.exit("Target", "Entry_A", limit = (strategy.openprofit > 0 ? upper_augm: na) , stop = SL, comment="Exit")


if in_position  and show_augm and slts and In_date()
    //Trigger trailing
    strategy.close("Entry_A", comment="SLT")

if not In_date()
    //Out of date trigger
    strategy.close("Entry_A", comment= "Out of date range")


// Plotting

plot(in_position ? SL > 0 ? SL : na : na , style = plot.style_circles, color = color.red, title = "Stop Loss")
plot(in_position ? trailing ? SLT > 0 ? SLT : na : na : na , style = plot.style_circles, color = color.blue, title = "Trailing Stop" )

s = plot(show_simp ? upper : na , color = color.aqua)
plot(show_simp ? middle_sim : na , color=color.red)
i = plot(show_simp ? lower : na , color = color.aqua)
fill(s,i, color=color.new(color.aqua,90))


plot(show_augm ? middle_augm : na , color=color.blue)
s_a = plot( show_augm ? upper_augm : na, color=color.orange)
i_a = plot( show_augm ? lower_augm : na, color= color.orange)
fill(s_a,i_a, color=color.new(color.orange, 90))