Strategi perdagangan kuantitatif tekanan dua arah

Gambaran keseluruhan
Strategi perdagangan kekuatan tekanan dua arah adalah strategi trend pengesanan yang menggabungkan penunjuk rawak dan penunjuk kuantiti. Strategi ini menggunakan garis K dan D penunjuk rawak dan garis kuantiti untuk menghasilkan isyarat beli dan jual, ditambah dengan garpu emas dan garpu mati garpu untuk menghasilkan isyarat tambahan.
Prinsip Strategi
Isyarat untuk membeli
Logik utama yang mencetuskan isyarat pembelian adalah:
-
Garis K dan Garis D sama-sama menembusi kawasan oversold (contohnya 20), dan menghasilkan persilangan ke atas, dan Garis K dan Garis D sama-sama berada dalam trend menaik
-
Jumlah transaksi melebihi tahap tertentu (contohnya 1.4 kali jumlah transaksi rata-rata)
-
Harga penutupan lebih tinggi daripada harga pembukaan (garis K putih)
Isyarat pembelian tambahan mungkin datang dari:
-
Garpu rata-rata: melalui EMA yang perlahan pada EMA yang cepat, dan kedua-dua garis rata-rata naik pada masa yang sama
-
Garis K dan Garis D secara serentak memasuki kawasan oversold dari paras rendah (contohnya naik dari bawah 20 ke dalam 20 hingga 80)
Jual isyarat
Logik utama yang mencetuskan isyarat menjual adalah:
-
Garis K dan Garis D memasuki kawasan terjual lebih (contohnya 80)
-
Fork mati rata-rata: EMA laju di bawah EMA perlahan
-
Garis bawah K melintasi Garis D, dan Garis K dan Garis D sama-sama dalam trend menurun
Isyarat berhenti
Tetapkan peratusan tertentu (contohnya 6%) daripada harga beli sebagai garis stop loss, dan jika harga jatuh di bawah garis ini, ia akan mencetuskan stop loss dan menjual.
Analisis kelebihan strategi
- Mengelakkan isyarat palsu dengan menggunakan penunjuk rawak ganda
- Gabungan penapisan bunyi lalu lintas untuk memastikan trend
- Menambah ketepatan dengan pelbagai isyarat
- Garis rata membantu menentukan arah trend besar
- Tetapkan strategi kawalan risiko
Kelebihan 1: Penunjuk rawak berganda mengelakkan isyarat palsu
Tanda rawak tunggal boleh menghasilkan banyak isyarat palsu. Strategi ini menggunakan gabungan dua tanda rawak K dan D (rata-rata bergerak garis K) yang dapat menyaring isyarat palsu dengan berkesan dan memastikan kebolehpercayaan isyarat.
Kelebihan 2: Penapisan bunyi lalu lintas untuk memastikan trend
Penambahan syarat jumlah transaksi sebagai kriteria penilaian tambahan, yang memerlukan jumlah transaksi melebihi tahap tertentu, untuk menyaring titik jual beli bukan trend yang rendah, mengurangkan risiko pegangan.
Kelebihan 3: Tambahan pelbagai isyarat, meningkatkan ketepatan
Strategi ini menggabungkan beberapa isyarat beli dan jual dalam bentuk acak, kuantiti, dan rata-rata, yang perlu dicetuskan secara serentak untuk menghasilkan isyarat perdagangan yang sebenar. Pelbagai isyarat yang disusun dapat meningkatkan kebolehpercayaan isyarat.
Kelebihan 4: Garis rata membantu menentukan arah trend besar
Menambahkan peraturan penghakiman garis rata-rata, misalnya hanya mempertimbangkan isyarat beli apabila garis rata-rata naik secara serentak. Ini dapat mengelakkan pembelian berlawanan atau puncak, dan menilai trend dari jangka masa yang besar.
Kelebihan 5: Setting Stop Loss Strategy dan Kawalan Risiko
Strategi ini mengandungi reka bentuk isyarat hentian, yang secara automatik berhenti jika harga jatuh di bawah satu peratusan pembelian. Ini dapat mengawal kerugian maksimum perdagangan tunggal dengan berkesan.
Analisis risiko
- Parameter strategi memerlukan penyesuaian yang teliti, dan penyesuaian yang tidak betul boleh menyebabkan prestasi yang buruk
- Tetapan titik henti perlu mengambil kira risiko melompat
- Risiko kecairan dalam varieti yang diperdagangkan
- Berhati-hati dengan risiko urutan dalam indikator pelbagai kitaran masa
Risiko 1: Parameter strategi memerlukan pengendalian yang teliti
Strategi ini merangkumi beberapa parameter, seperti parameter penunjuk rawak, parameter rata-rata, dan parameter kuantiti yang dihasilkan. Parameter-parameter ini perlu dioptimumkan untuk pelbagai jenis, dan penyesuaian yang tidak betul boleh menyebabkan keputusan yang kurang baik.
Risiko 2: Tetapan titik henti perlu mengambil kira risiko melompat
Apabila menetapkan titik berhenti, anda perlu mempertimbangkan kemungkinan harga melompat. Jika titik berhenti terlalu dekat dengan harga beli, ia mungkin melompat menyebabkan berhenti yang tidak perlu.
Risiko 3: Perhatian terhadap risiko kecairan dalam jenis dagangan
Bagi jenis yang kurang bergerak, peraturan kuantiti perpindahan mungkin menapis terlalu banyak isyarat. Pada masa ini, anda perlu menurunkan had syarat kuantiti perpindahan.
Risiko 4: Risiko urutan bit yang perlu diperhatikan dalam pelbagai kitaran masa
Masalah ketidakselarasan urutan antara pelbagai petunjuk kitaran mungkin berlaku, yang boleh menjejaskan ketepatan isyarat. Perlu mengesahkan kesesuaian urutan titik isyarat.
Arah pengoptimuman
Strategi ini boleh dioptimumkan dalam beberapa aspek:
-
Optimumkan parameter untuk meningkatkan kestabilan
-
Menambah parameter penyesuaian dinamik kaedah pembelajaran mesin
-
Optimumkan strategi berhenti kerugian untuk mengurangkan kadar berhenti kerugian
-
Menambah lebih banyak syarat penapisan untuk mengurangkan jumlah transaksi
-
Cuba strategi bersyarat atau berhenti untuk meningkatkan kadar pulangan
Arah 1: Optimumkan parameter untuk meningkatkan kestabilan
Parameter utama boleh dioptimumkan melalui kaedah yang lebih sistematik seperti algoritma genetik, memastikan parameter dapat memperoleh prestasi yang stabil dalam kitaran pasaran yang berbeza.
Arah 2: Menambah parameter penyesuaian dinamik kaedah pembelajaran mesin
Model boleh dilatih untuk menilai keadaan pasaran dalam masa nyata, dan menyesuaikan parameter strategi dengan itu, untuk mencapai optimasi dinamik parameter.
Arahan 3: Optimumkan strategi berhenti kerugian untuk mengurangkan kadar berhenti kerugian
Anda boleh mengkaji strategi penutupan kerugian yang lebih baik, mengurangkan kerugian yang tidak perlu dan meningkatkan ruang keuntungan sambil mengekalkan kawalan risiko.
Arah 4: Tambah lebih banyak syarat penapisan untuk mengurangkan jumlah transaksi
Memperkuat syarat penapisan dengan sewajarnya untuk mengurangkan jumlah transaksi, mengurangkan kesan kos transaksi, dan menjadikan setiap transaksi lebih baik.
Arahan 5: Cuba strategi bersyarat atau berhenti untuk meningkatkan kadar pulangan
Ia boleh direka mengikut ciri-ciri pasaran, strategi tunggal syarat atau strategi berhenti bergerak, sambil menjamin hentian kerugian, untuk memaksimumkan keuntungan.
ringkaskan
Strategi ini mempertimbangkan pelbagai aspek seperti penilaian trend, kawalan risiko, frekuensi perdagangan. Kelebihan utamanya adalah penunjuk acak ganda yang menggabungkan penilaian trend indikator kuantiti pertukaran, dan mekanisme hentian risiko yang terkawal.
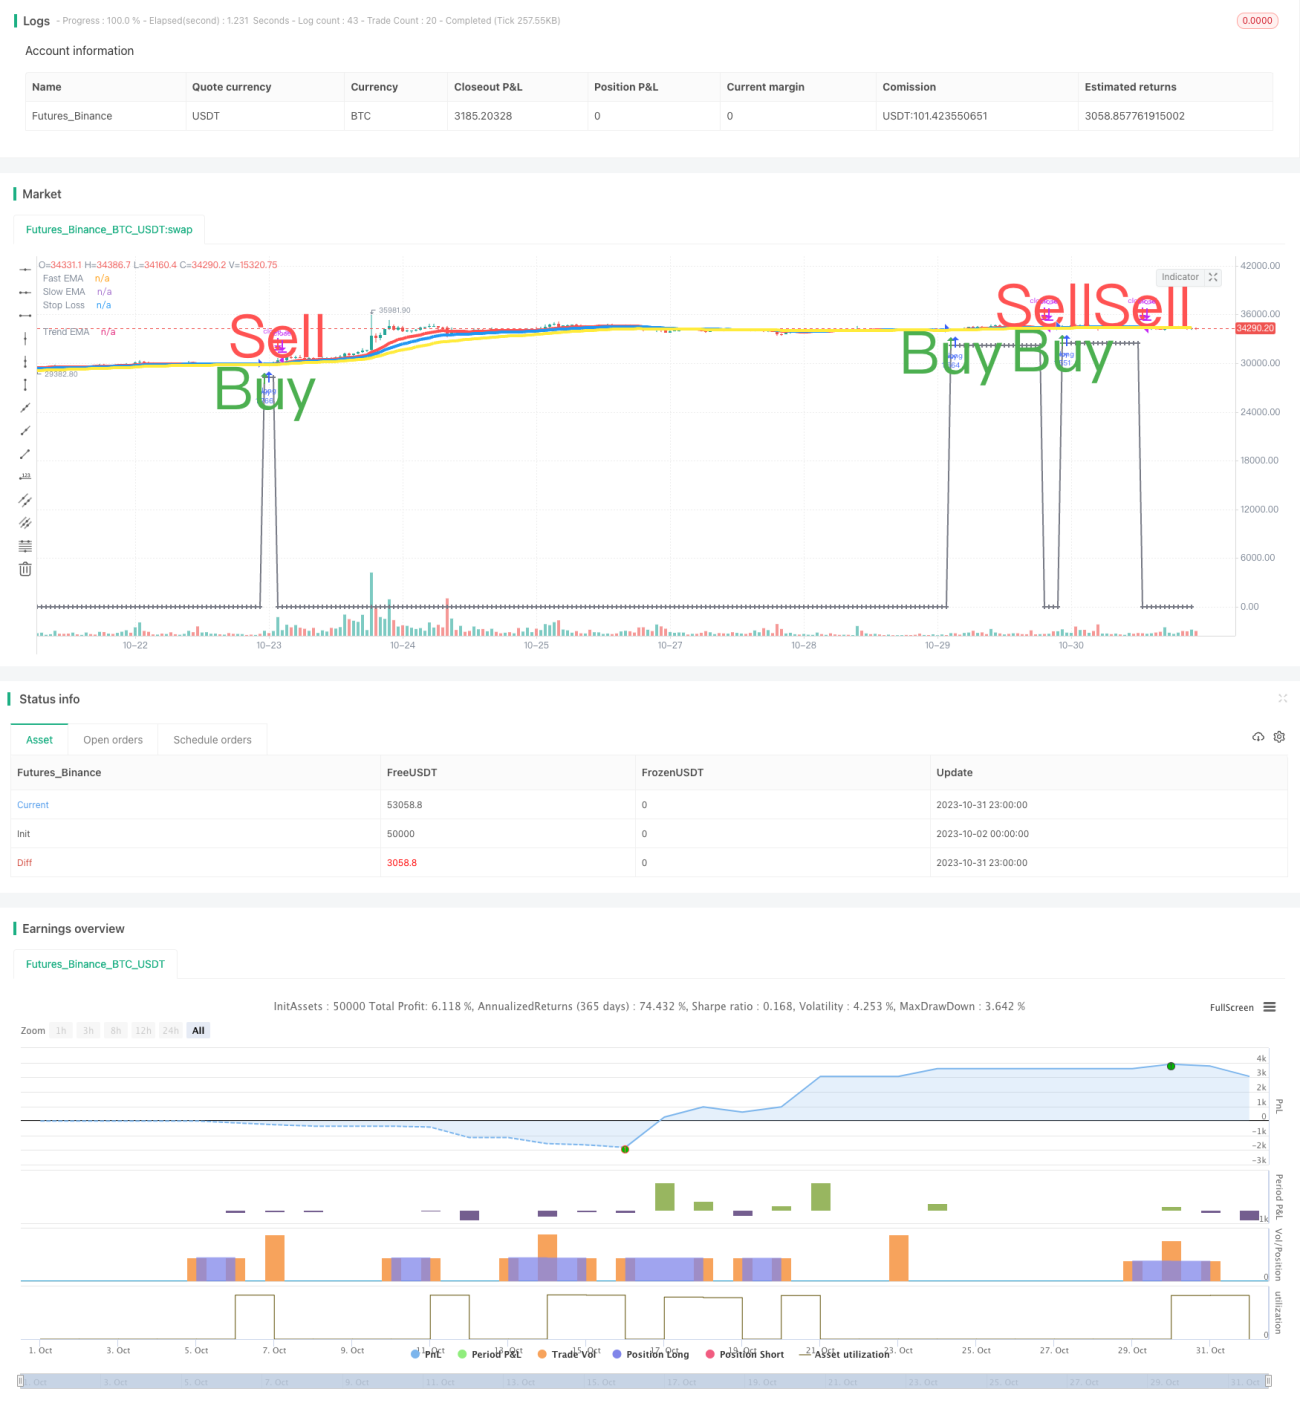
/*backtest
start: 2023-10-02 00:00:00
end: 2023-11-01 00:00:00
period: 1h
basePeriod: 15m
exchanges: [{"eid":"Futures_Binance","currency":"BTC_USDT"}]
*/

//@version=3
// SW SVE - Stochastic+Vol+EMAs [Sergio Waldoke]
// Script created by Sergio Waldoke (BETA VERSION v0.5, fine tuning PENDING)
// Stochastic process is the main source of signals, reinforced on buying by Volume. Also by Golden Cross.- 1