Strategi dagangan kuantitatif menggunakan pelbagai penunjuk untuk mengenal pasti titik pembalikan dagangan

Gambaran keseluruhan
Strategi ini menggunakan lima indikator utama EMA, VWAP, MACD, Bollinger Bands dan Schaff Trend Cycle untuk mengenal pasti titik balik harga dalam julat tertentu, dan menghantar isyarat membeli dan menjual. Keuntungan strategi ini adalah bahawa anda boleh menyesuaikan pakej indikator mengikut pasaran yang berbeza, mengurangkan kebarangkalian isyarat palsu, dan meningkatkan kebarangkalian keuntungan.
Prinsip Strategi
-
EMA rata-rata menilai arah trend besar, hanya membeli di arah trend
-
VWAP menilai aliran dana institusi, hanya membeli ke arah pembelian institusi
-
MACD menilai trend garis pendek dan perubahan momentum, garis MACD mematahkan garis isyarat sebagai isyarat beli / jual
-
Bollinger Bands menilai sama ada terlampau atau terjual, harga melintasi laluan bawah dianggap sebagai isyarat beli / jual
-
Schaff Trend Cycle menilai bahawa struktur penumpuan jangka pendek, melebihi nilai terhad yang tinggi atau rendah dianggap sebagai isyarat beli / jual
-
Apabila lima indikator yang besar memberi isyarat yang sama, ia akan memberi arahan beli/jual.
-
Tetapkan titik hentian dan penangguhan, optimumkan pengurusan wang
Kelebihan Strategik
- Kombinasi pelbagai indikator mengurangkan kemungkinan isyarat palsu
Menggunakan gabungan pelbagai petunjuk seperti EMA, VWAP, MACD, BB dan STC, ia boleh disahkan antara satu sama lain, mengurangkan isyarat palsu yang dihasilkan oleh satu petunjuk tunggal, dan dengan itu meningkatkan kebolehpercayaan isyarat.
- Penunjuk boleh disesuaikan
Mengizinkan pilihan sama ada untuk menggunakan salah satu indikator, kombinasi indikator boleh dibuat mengikut pelbagai jenis dan keadaan pasaran, menjadikan strategi lebih disasarkan dan disesuaikan.
- Pengurusan wang yang lebih baik
Tetapkan titik berhenti dan titik berhenti, anda boleh mengehadkan kerugian tunggal, dan mengunci sebahagian keuntungan, untuk pengurusan wang yang lebih baik.
- Strategi yang jelas
Menggunakan petunjuk yang mudah difahami, dan dilengkapi dengan kod terperinci, keseluruhan strategi mudah difahami dan diubah suai.
- Berguna
Pelbagai penunjuk digunakan secara meluas, parameter yang ditetapkan adalah munasabah, boleh digunakan secara langsung untuk perdagangan cakera, dan tidak memerlukan pengoptimuman yang besar untuk mencapai kesan yang baik.
Risiko Strategik
- Risiko untuk mengenal pasti perubahan dalam penunjuk
EMA, MACD dan lain-lain mungkin terlewat dalam mengesan perubahan harga dan mungkin terlepas masa pembelian terbaik.
- Risiko parameter yang tidak betul
Jika parameter penunjuk tidak ditetapkan dengan betul, banyak isyarat palsu akan dihasilkan dan tidak dapat menjalankan strategi dengan betul.
- Risiko yang tidak dijamin
Kombinasi pelbagai indikator dapat meningkatkan kadar kemenangan, tetapi tidak dapat memastikan setiap perdagangan mendapat keuntungan. Perubahan keadaan pasaran boleh menyebabkan penurunan kadar kemenangan.
- Stop loss menetapkan risiko yang terlalu kecil
Jika titik penangguhan ditetapkan terlalu kecil, ia mungkin dihentikan semasa harga turun naik secara normal, meningkatkan kerugian yang tidak perlu.
Arah pengoptimuman strategi
- Menambah model pembelajaran mesin untuk menilai kebolehpercayaan isyarat
Model boleh dilatih untuk menilai kebolehpercayaan isyarat pelbagai petunjuk, memberi penilaian kepada isyarat, dan mengurangkan isyarat palsu.
- Meningkatkan penunjuk kuantitatif untuk mengenal pasti trend
Menambah beberapa penunjuk kuantitatif seperti OBV, untuk mengenal pasti tanda-tanda kenaikan harga dan meningkatkan kepastian tempat pembelian.
- Mengoptimumkan strategi hentian kerugian
Anda boleh mengkaji strategi stop loss atau kunci keuntungan bergerak yang lebih sesuai dengan strategi ini, dan mengoptimumkan pengurusan wang.
- Optimumkan parameter
Mengoptimumkan parameter bagi setiap indikator dengan pengulangan yang lebih sistematik, meningkatkan ketahanan keseluruhan strategi.
- Peningkatan perdagangan robot
Menghubungkan API transaksi, melaksanakan pesanan automatik, membolehkan strategi beroperasi secara benar-benar tanpa pengawal.
ringkaskan
Strategi ini menggabungkan kelebihan pelbagai petunjuk teknikal, idea yang jelas, praktikal, boleh digunakan sebagai rujukan keputusan perdagangan diskretionari, atau boleh digunakan secara langsung untuk perdagangan algoritma. Tetapi masih perlu melakukan penyesuaian optimum untuk varieti dan persekitaran pasaran tertentu, mengurangkan risiko dan meningkatkan kestabilan, dan akhirnya dapat mengekalkan keuntungan yang stabil di pasaran nyata.
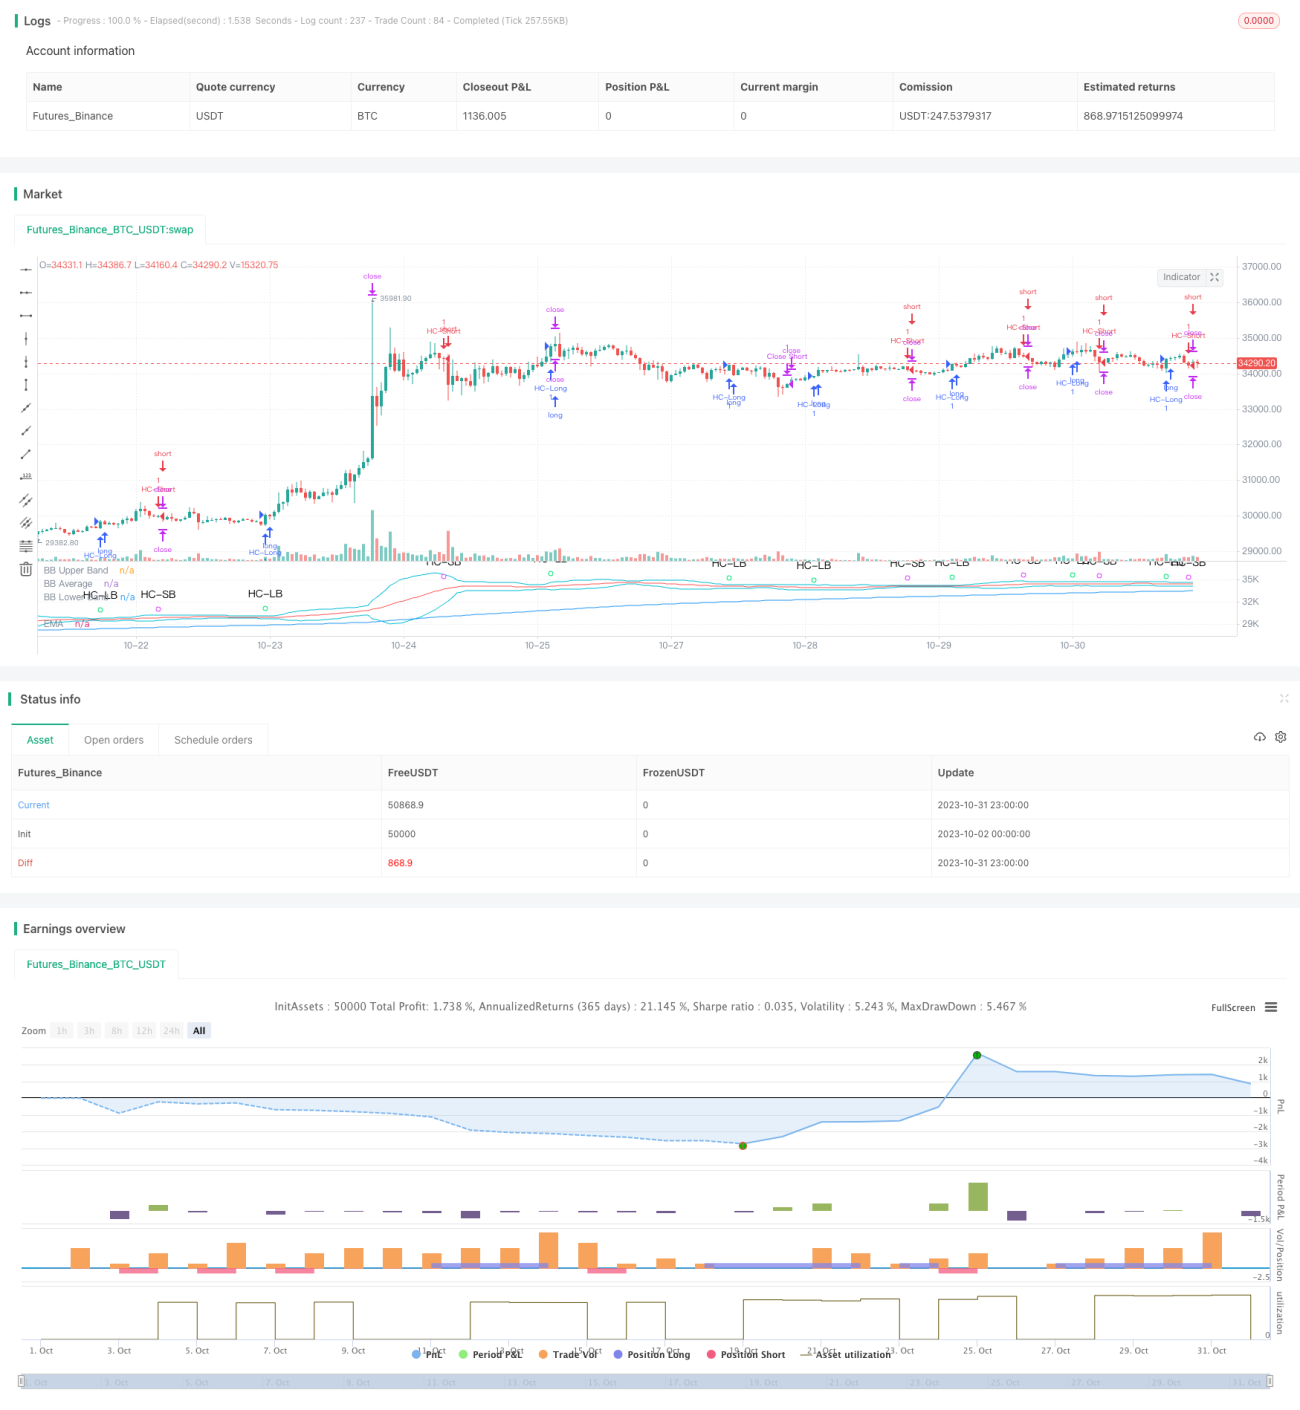
/*backtest
start: 2023-10-02 00:00:00
end: 2023-11-01 00:00:00
period: 1h
basePeriod: 15m
exchanges: [{"eid":"Futures_Binance","currency":"BTC_USDT"}]
*/

//@version=4

// This source code is subject to the terms of the Mozilla Public License 2.0 at https://mozilla.org/MPL/2.0/
// © MakeMoneyCoESTB2020- 1