Strategi Dagangan Talian

Gambaran keseluruhan
Strategi ini adalah berdasarkan kepada idea untuk memecahkan sokongan dan rintangan utama, dengan mengenal pasti garis trend naik dan turun yang penting dalam carta harga, untuk berdagang apabila harga memecahkan garis trend. Strategi ini mudah, boleh dipercayai, dan sesuai untuk keadaan pasaran yang jelas trend.
Prinsip Strategi
Strategi ini mengenal pasti titik-titik penting kenaikan dan penurunan harga dengan mengira titik-titik tinggi dan rendah pada garis-garis tiang di sebelah kiri dan kanan, untuk mendapatkan garis-garis sokongan dan tekanan. Secara khusus:
-
guna
pivothigh()danpivotlow()Fungsi mengesan titik tinggi dan rendah yang kritikal. -
Persamaan untuk melukis garis sokongan dan garis tekanan berdasarkan titik tinggi dan rendah.
-
Apabila harga menembusi garisan tekanan, buat lebih; apabila harga menembusi garisan sokongan, buat kosong.
-
Bergantung kepada arah trend, anda boleh memilih untuk melakukan lebih banyak atau lebih sedikit.
-
Anda boleh memilih sama ada anda akan bertukar arah pada waktu penembusan.
-
Anda boleh memilih untuk menggunakan stop loss, stop stop, dan stop loss.
-
Anda boleh memilih untuk berhenti Swing, berhenti ATR, dan berhenti tetap.
Strategi ini adalah mudah dan praktikal untuk memecahkan perdagangan dengan petunjuk trend yang mudah, menggabungkan trend tracking dan trend reversal.
Analisis kelebihan
- Strategi ini lebih mudah difahami dan dilaksanakan.
- Dengan menggunakan teori terobosan, terdapat kelebihan kebarangkalian tertentu.
- Anda boleh menetapkan Stop Loss Stop dan mengawal risiko.
- Ia boleh digunakan untuk trend track atau trend reverse.
- Parameter yang boleh dioptimumkan untuk persekitaran pasaran yang berbeza.
Analisis risiko
- Mungkin terdapat salah maklumat mengenai isyarat penembusan.
- Penetapan titik henti yang tidak betul boleh meningkatkan kerugian.
- Operasi pembalikan mempunyai risiko tersandung.
- Parameter tuning memerlukan pengalaman, dan ia mungkin tidak berfungsi jika tidak ditetapkan dengan betul.
- "Breakthrough trend" tidak boleh digunakan dalam keadaan gegaran.
Risiko boleh dikurangkan dengan mengoptimumkan strategi hentikan kerugian, menilai kualiti isyarat penembusan, menilai masa pembalikan dan sebagainya.
Arah pengoptimuman
- Untuk menilai kebolehpercayaan isyarat penembusan dan meningkatkan ketepatan.
- Gabungan dengan volume, meningkatkan isyarat penembusan.
- Mengoptimumkan strategi hentikan kerugian dan menyesuaikan diri dengan turun naik pasaran.
- Penilaian masa terbaik untuk berbalik.
- parameter tuning。
- Menilai model pelbagai faktor.
- Kajian ini digunakan bersama-sama dengan penunjuk lain.
ringkaskan
Strategi ini secara keseluruhannya mudah dan praktikal, untuk menangkap trend harga melalui pemecahan trend yang mudah, risiko yang boleh dikawal. Strategi ini dapat dioptimumkan melalui pelbagai aspek, untuk digunakan dalam lebih banyak keadaan pasaran, dan secara keseluruhannya adalah strategi trend yang sangat praktikal.
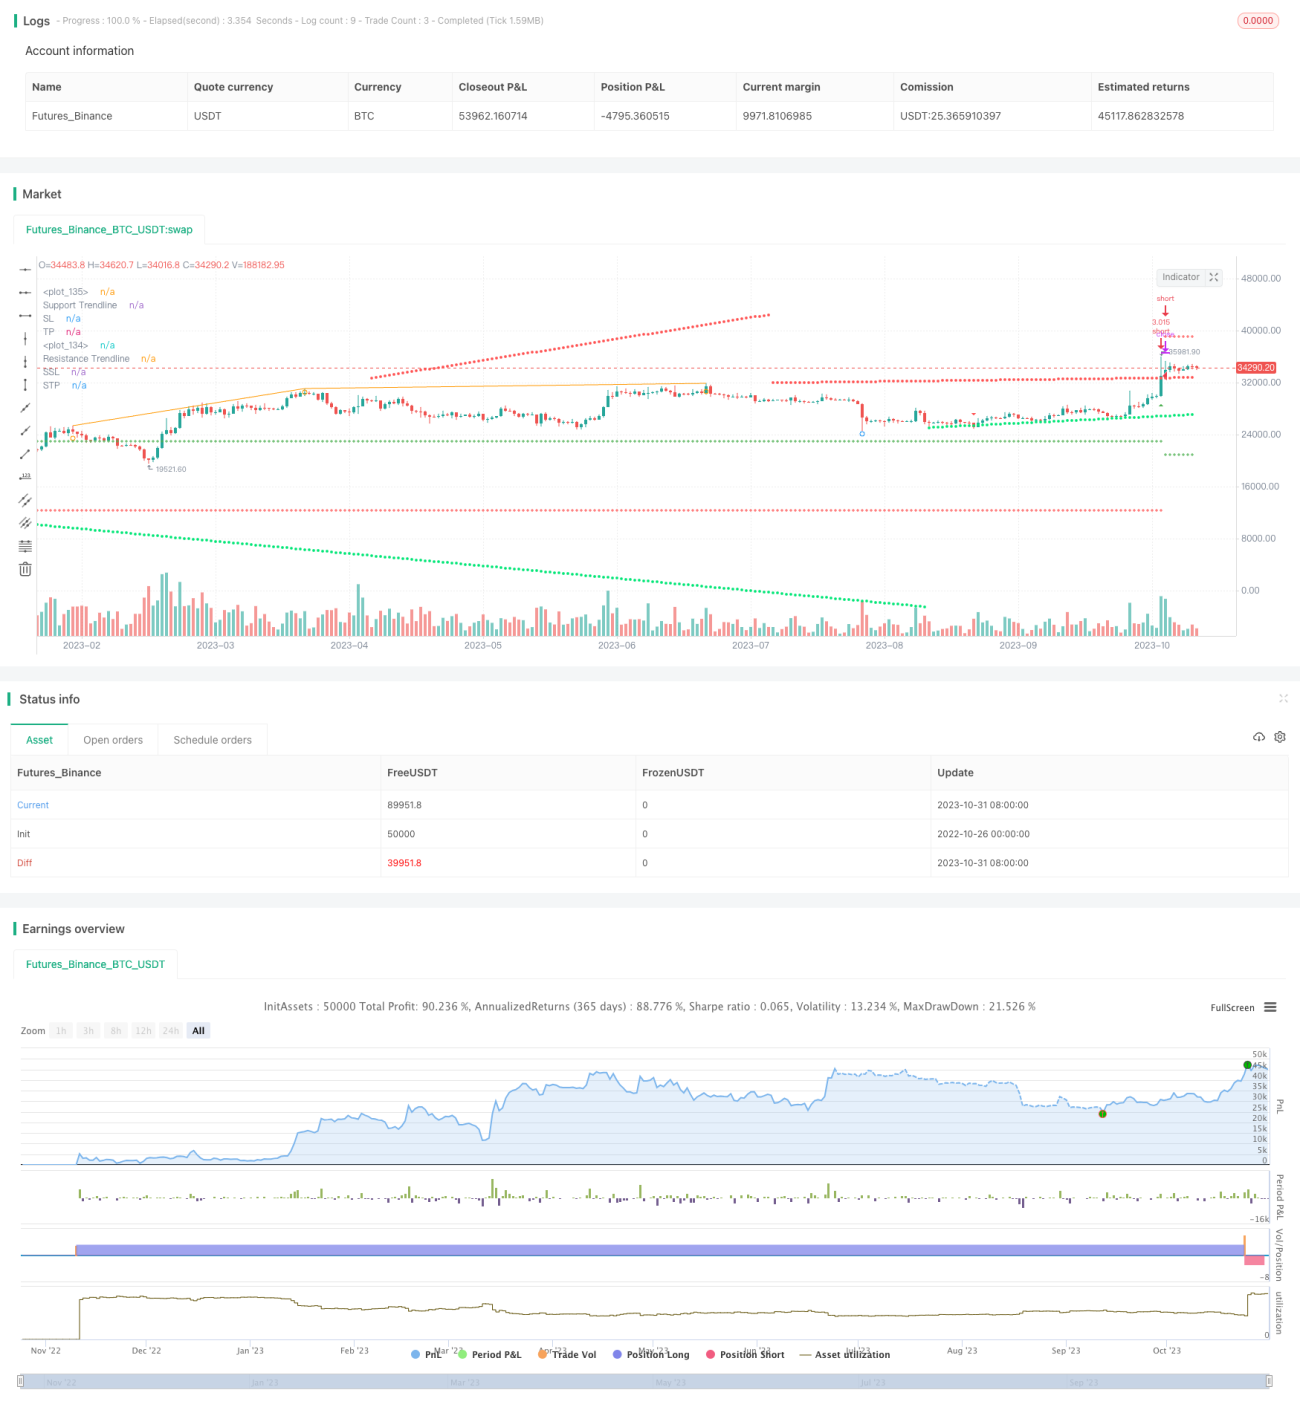
/*backtest
start: 2022-10-26 00:00:00
end: 2023-11-01 00:00:00
period: 1d
basePeriod: 1h
exchanges: [{"eid":"Futures_Binance","currency":"BTC_USDT"}]
*/

// This source code is subject to the terms of the Mozilla Public License 2.0 at https://mozilla.org/MPL/2.0/
// © tweakerID and © BacktestRookies

// Using the clever calculations and code by BacktestRookies, here is a strategy that buys - 1