Strategi perdagangan kuantitatif RSI berganda

Gambaran keseluruhan
Strategi ini menggunakan indikator RSI ganda untuk perdagangan dua arah panjang dan pendek, dan digabungkan dengan sistem garis rata untuk menentukan arah trend, termasuk dalam strategi kuantitatif RSI ganda. Strategi ini pertama menggunakan indikator RSI untuk menentukan isyarat kosong, kemudian digabungkan dengan garis rata untuk menentukan arah trend untuk membuat keputusan untuk melakukan lebih banyak shorting, termasuk dalam strategi trend mengikut trend yang tipikal.
Analisis asas
Strategi kuantifikasi RSI ganda menggunakan indikator RSI dua kitaran masa untuk membuat keputusan mengenai isyarat perdagangan. Strategi pertama menetapkan dua parameter RSI, satu kitaran yang lebih lama sebagai keputusan perdagangan utama, dan satu kitaran yang lebih pendek sebagai penapis tambahan.
Untuk menyaring isyarat palsu, strategi juga memperkenalkan SMA dan EMA untuk menilai trend. Hanya apabila rantaian jangka pendek SMA melintasi rantaian EMA jangka panjang, pertimbangkan RSI untuk membuat banyak isyarat, dan hanya apabila rantaian jangka pendek SMA melintasi rantaian EMA jangka panjang, pertimbangkan RSI untuk membuat isyarat kosong, pastikan isyarat RSI ganda selaras dengan arah trend, dan elakkan perdagangan berlawanan dengan trend.
Selain itu, strategi ini juga menetapkan logik stop loss. Apabila anda membuka kedudukan, anda akan menerima dua jumlah pesanan berhenti yang berbeza pada masa yang sama, dan anda akan menetapkan kedudukan berhenti.
Analisis kelebihan
Strategi kuantiti RSI berganda mempunyai kelebihan berikut:
-
Indikator RSI dua kitaran masa dapat menilai lebih tepat isyarat kosong. Kombinasi silang RSI jangka panjang dan pendek dapat menapis beberapa isyarat palsu dan meningkatkan kualiti isyarat.
-
Sistem garis rata membantu menentukan arah trend besar, mengelakkan perdagangan berlawanan trend, dapat menyaring kebanyakan perdagangan bising, meningkatkan kadar kemenangan.
-
Mekanisme Stop Loss Flexible, yang membolehkan anda mendapatkan keuntungan yang lebih tinggi melalui pelbagai tetapan Stop Loss, dan juga boleh menghentikan risiko.
-
Strategi perdagangan logik mudah dan jelas, mudah difahami dan dioptimumkan, sesuai untuk dipelajari oleh pedagang kuantitatif.
Analisis risiko
Walaupun ada kelebihan yang dimiliki oleh strategi kuantitatif RSI ganda, terdapat juga risiko berikut:
-
Indeks RSI sendiri tidak memberi kesan kepada penilaian pergerakan goyah dan pembalikan trend, strategi ini mungkin tidak berkesan dalam perdagangan di pasaran ini.
-
Walaupun sistem garis rata dapat menyaring kebisingan kecil, ia tidak dapat menilai perubahan trend dalam kitaran pertengahan dan mungkin terlepas titik perubahan trend.
-
Tetapan stop loss yang tidak betul boleh menyebabkan stop loss terlalu lebar atau stop loss terlalu kecil, mengurangkan keberkesanan strategi.
-
Pelanggaran besar-besaran boleh menyebabkan kerugian yang lebih besar dan perlu mengawal saiz kedudukan.
Untuk risiko di atas, risiko boleh dikurangkan dengan menyesuaikan parameter RSI, memperkenalkan trend yang lebih maju dan indikator pembalikan, mengoptimumkan logik stop loss, dan mengawal kedudukan.
Arah pengoptimuman
Strategi kuantifikasi RSI berganda boleh dioptimumkan lebih jauh dari beberapa arah:
-
Cuba kombinasi parameter yang berbeza, optimumkan parameter kitaran RSI, dan cari kombinasi indikator RSI jangka panjang dan pendek yang terbaik.
-
Uji pelbagai penunjuk rata-rata, memperkenalkan penunjuk seperti MACD untuk menilai trend dan peluang pembalikan.
-
Mengoptimumkan strategi hentian hentian, menetapkan hentian pengesanan atau hentian bergerak, menjadikan hentian hentian lebih fleksibel.
-
Tambah modul kawalan kedudukan, kawalan melakukan lebih banyak kedudukan shorting pada peringkat yang berbeza dalam trend kitaran besar.
-
Menambah model pembelajaran mesin untuk meningkatkan ketepatan entries dan exits
-
Untuk mengoptimumkan pelaksanaan analisis, cari jenis dan jangka masa perdagangan yang terbaik.
ringkaskan
Strategi kuantitatif RSI ganda secara keseluruhan adalah strategi pengesanan trend yang tipikal. Ia menggabungkan strategi strategi untuk menilai isyarat perdagangan dengan indikator RSI ganda dan sistem penapisan kebisingan sistem yang seragam sangat klasik dan praktikal. Walaupun strategi juga mempunyai ruang untuk penambahbaikan, tetapi logik operasi keseluruhan jelas, mudah difahami dan dioptimumkan. Ini adalah strategi yang sangat sesuai untuk pembelajaran dan amalan pemula perdagangan kuantitatif.
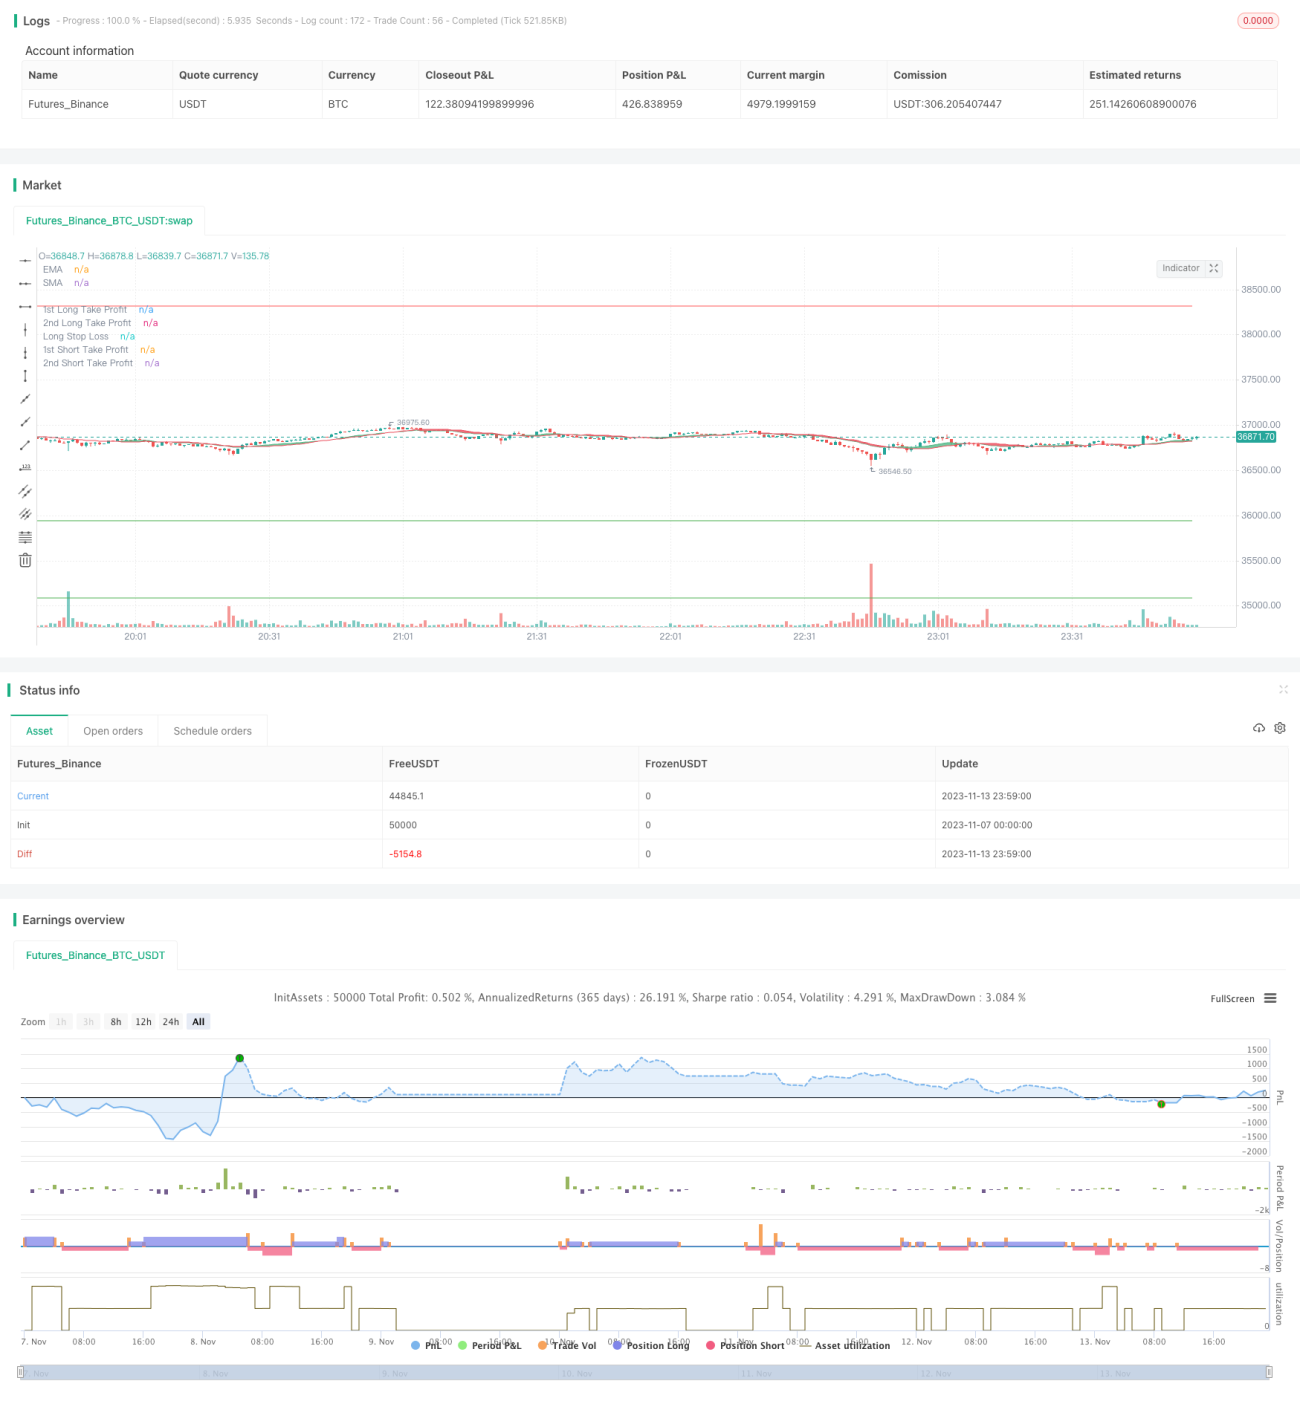
/*backtest
start: 2023-11-07 00:00:00
end: 2023-11-14 00:00:00
period: 1m
basePeriod: 1m
exchanges: [{"eid":"Futures_Binance","currency":"BTC_USDT"}]
*/

//@version=4
strategy("Growth Producer", overlay=true, initial_capital = 1000, currency = "USD", pyramiding = 2, commission_type=strategy.commission.percent, commission_value=0.07, default_qty_type = strategy.percent_of_equity, default_qty_value = 100)

//Functions- 1