Strategi Perbezaan Diskret RSI


Tarikh penciptaan: 2023-11-16 11:36:45 Akhirnya diubah suai: 2023-11-16 11:36:45
Salin: 0 Bilangan klik: 862
1
fokus pada
1617
Pengikut

Strategi Perbezaan Diskret RSI

Gambaran keseluruhan

Kaedah ini digunakan untuk menilai kedudukan kosong dengan mengira persilangan antara RSI dan garis rata-rata EMA, dan menggabungkan RSI dengan harga untuk mencari titik jual beli yang berpotensi.

Prinsip Strategi

  1. Indikator RSI dengan panjang 14 dikira, apabila RSI melintasi 50 garis sempadan di atas untuk melihat lebih banyak isyarat, di bawah untuk melihat lebih banyak isyarat.

  2. Hitung garis purata EMA 20 kitaran dan garis purata EMA 14 kitaran RSI, apabila garis pantas melintasi garis perlahan sebagai isyarat beli, dan bawah melintasi sebagai isyarat jual.

  3. Untuk mengesan perbezaan antara RSI dan harga:

  • Berpaling: Harga berinovasi rendah tetapi RSI tidak berinovasi rendah, memberi isyarat untuk membeli

  • Hidden Multiple Head Off: Harga Berinovasi Tinggi Tetapi RSI Tidak Berinovasi Tinggi, Isyarat Untuk Beli

  • Harga Berinovasi Tinggi Tetapi RSI Tidak Berinovasi Tinggi, Untuk Sinyal Jualan

  • Hidden Blank Turn: Harga Berinovasi Rendah Tetapi RSI Tidak Berinovasi Rendah, Untuk Menjual Isyarat

  1. Anda boleh memilih untuk membuka strategi hentian, termasuk hentian peratusan dan hentian ATR.

Analisis kelebihan

  1. Kelebihan RSI ialah ia dapat mengesan keadaan overbought dan oversold. Kelebihan EMA adalah ia dapat berfungsi sebagai penyejuk, memadamkan sebahagian bunyi.

  2. RSI dan harga yang tidak selaras boleh memberi isyarat awal sebelum trend berbalik.

  3. Mengintegrasikan dua isyarat penunjuk untuk saling mengesahkan dan meningkatkan kestabilan strategi.

  4. Mekanisme Henti Kerosakan boleh mengawal kerugian tunggal.

Analisis risiko

  1. RSI sebagai indikator indeks yang bergelombang dengan harga, penggunaan RSI akan diskaun apabila harga bergelombang dengan kuat.

  2. EMA rata-rata mempunyai masalah kelewatan masa, tidak dapat menentukan titik perubahan.

  3. Jika harga bergerak jauh dari isyarat, isyarat palsu mungkin muncul dan harga akan terus bergerak.

  4. Tetapan titik henti yang tidak munasabah boleh menyebabkan hentian yang tidak perlu.

  5. Pengunduran mungkin besar dan memerlukan sokongan kewangan yang mencukupi.

Arah pengoptimuman

  1. Anda boleh menguji parameter yang berbeza untuk mengira RSI dan EMA untuk mencari kombinasi parameter terbaik.

  2. Garis purata EMA boleh dipertimbangkan untuk digantikan dengan petunjuk lain seperti MACD, untuk pengoptimuman gabungan.

  3. Mekanisme pengesahan boleh ditetapkan untuk mengelakkan penyimpangan palsu. Jika perlu, beberapa isyarat penyimpangan berturut-turut boleh dicetuskan.

  4. Menambah strategi penangguhan untuk mengunci keuntungan.

  5. Anda boleh memasuki pasaran berdasarkan isyarat jangka pendek seperti corak candlestick, dan menilai trend dengan strategi ini.

ringkaskan

Strategi ini mengintegrasikan penilaian overbought dan oversold RSI, penilaian trend EMA, dan ramalan isyarat deviasi untuk membentuk satu sistem pemantauan trend yang lebih lengkap. Kesan strategi yang lebih baik boleh diperoleh berdasarkan penyesuaian parameter dan pengoptimuman kombinasi. Namun, perlu berhati-hati untuk mengelakkan kejutan dan gangguan isyarat palsu di pasaran yang sedang tren.
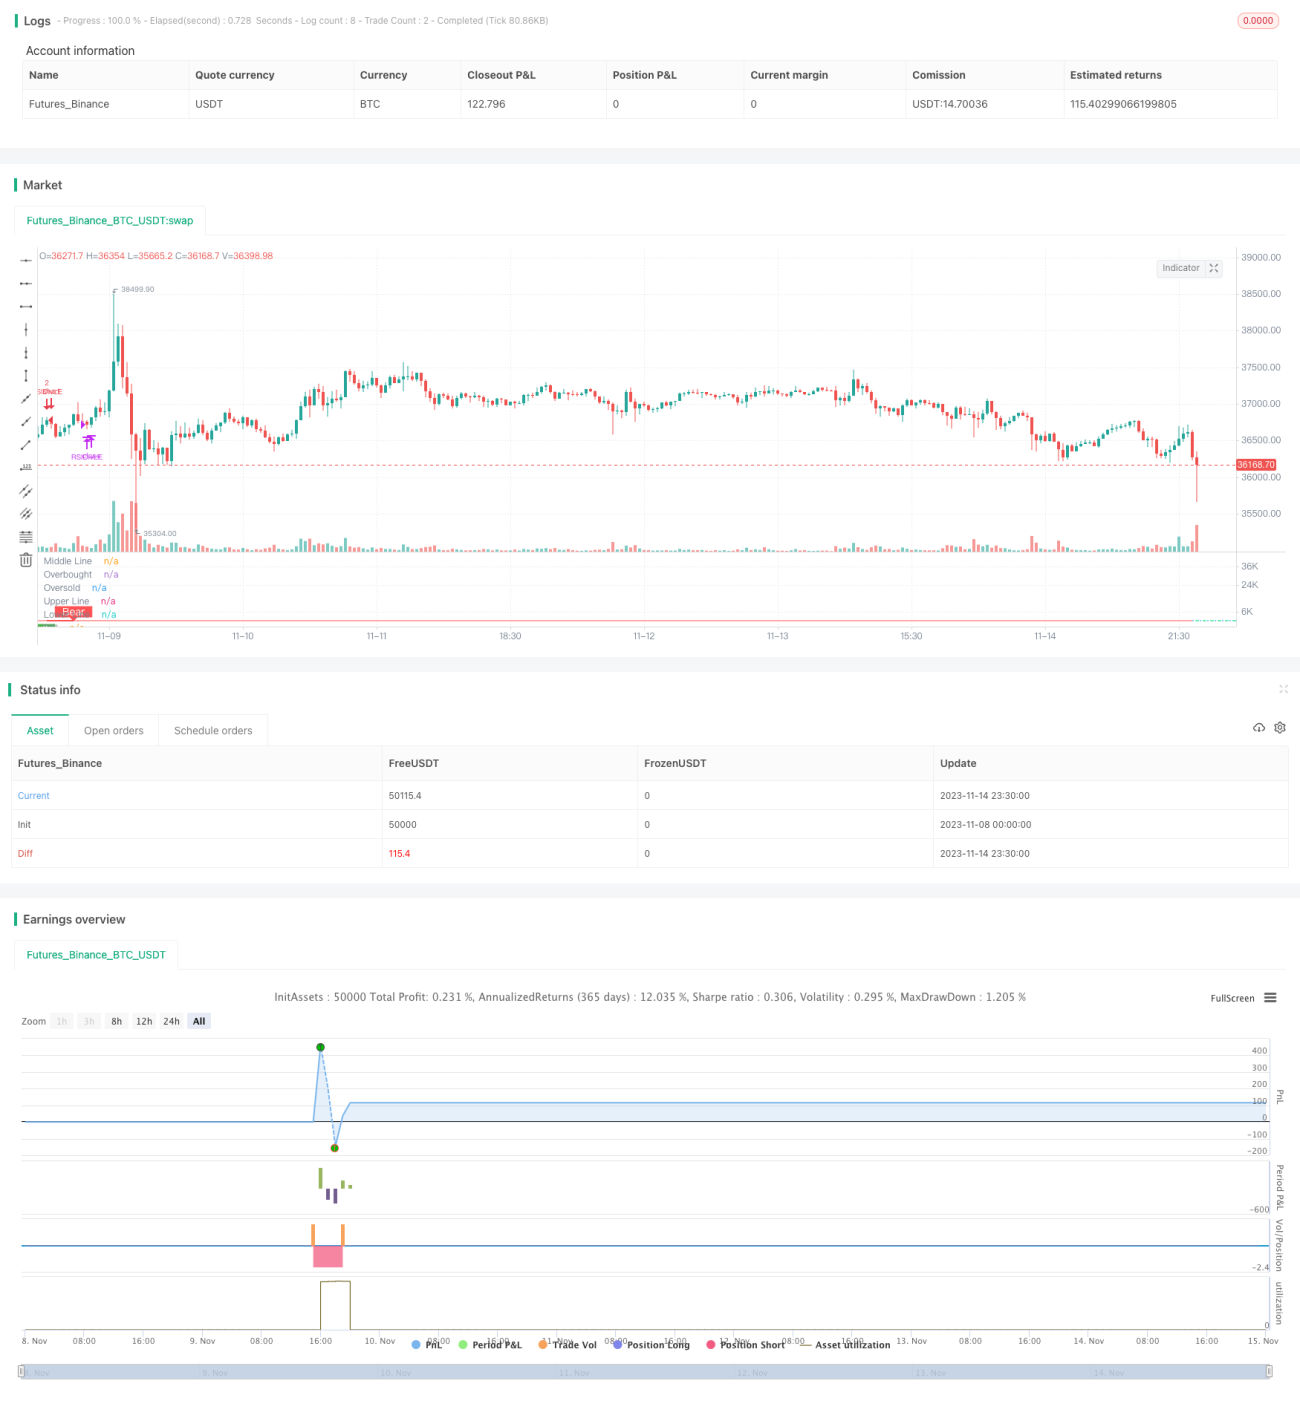
Kod sumber strategi
/*backtest
start: 2023-11-08 00:00:00
end: 2023-11-15 00:00:00
period: 30m
basePeriod: 15m
exchanges: [{"eid":"Futures_Binance","currency":"BTC_USDT"}]
*/

//@version=4
strategy(title="RSI Divergence Indicator", overlay=false,pyramiding=2, default_qty_value=2,   default_qty_type=strategy.fixed, initial_capital=10000, currency=currency.USD)

len = input(title="RSI Period", minval=1, defval=14)
src = input(title="RSI Source", defval=close)
lbR = input(title="Pivot Lookback Right", defval=3)
lbL = input(title="Pivot Lookback Left", defval=1)
takeProfitRSILevel = input(title="Take Profit at RSI Level", minval=70, defval=80)

rangeUpper = input(title="Max of Lookback Range", defval=60)
rangeLower = input(title="Min of Lookback Range", defval=5)
plotBull = input(title="Plot Bullish", defval=true)
plotHiddenBull = input(title="Plot Hidden Bullish", defval=true)
plotBear = input(title="Plot Bearish", defval=true)
plotHiddenBear = input(title="Plot Hidden Bearish", defval=false)

sl_type = input("NONE", title="Trailing StopLoss Type", options=['ATR','PERC', 'NONE'])

stopLoss = input(title="Stop Loss%", defval=5, minval=1)

atrLength=input(14, title="ATR Length (for Trailing stop loss)")
atrMultiplier=input(3.5, title="ATR Multiplier (for Trailing stop loss)")


bearColor = color.red
bullColor = color.green
hiddenBullColor = color.new(color.green, 80)
hiddenBearColor = color.new(color.red, 80)
textColor = color.white
noneColor = color.new(color.white, 100)

osc = rsi(src, len)

plot(osc, title="RSI", linewidth=2, color=color.white)
hline(50, title="Middle Line", linestyle=hline.style_dotted)
obLevel = hline(70, title="Overbought", linestyle=hline.style_dotted)
osLevel = hline(30, title="Oversold", linestyle=hline.style_dotted)
fill(obLevel, osLevel, title="Background", color=color.gray, transp=90)

plFound = na(pivotlow(osc, lbL, lbR)) ? false : true
phFound = na(pivothigh(osc, lbL, lbR)) ? false : true

_inRange(cond) =>
    bars = barssince(cond == true)
    rangeLower <= bars and bars <= rangeUpper

//------------------------------------------------------------------------------
// Regular Bullish

// Osc: Higher Low
oscHL = osc[lbR] > valuewhen(plFound, osc[lbR], 1) and _inRange(plFound[1])

// Price: Lower Low
priceLL = low[lbR] < valuewhen(plFound, low[lbR], 1)

bullCond = plotBull and priceLL and oscHL and plFound

plot(
	 plFound ? osc[lbR] : na,
	 offset=-lbR,
	 title="Regular Bullish",
	 linewidth=2,
	 color=(bullCond ? bullColor : noneColor),
	 transp=0
	 )


plotshape(
	 bullCond ? osc[lbR] : na,
	 offset=-lbR,
	 title="Regular Bullish Label",
	 text=" Bull ",
	 style=shape.labelup,
	 location=location.absolute,
	 color=bullColor,
	 textcolor=textColor,
	 transp=0
	 )

//------------------------------------------------------------------------------
// Hidden Bullish

// Osc: Lower Low
oscLL = osc[lbR] < valuewhen(plFound, osc[lbR], 1) and _inRange(plFound[1])

// Price: Higher Low
priceHL = low[lbR] > valuewhen(plFound, low[lbR], 1)

hiddenBullCond = plotHiddenBull and priceHL and oscLL and plFound

plot(
	 plFound ? osc[lbR] : na,
	 offset=-lbR,
	 title="Hidden Bullish",
	 linewidth=2,
	 color=(hiddenBullCond ? hiddenBullColor : noneColor),
	 transp=0
	 )

plotshape(
	 hiddenBullCond ? osc[lbR] : na,
	 offset=-lbR,
	 title="Hidden Bullish Label",
	 text=" H Bull ",
	 style=shape.labelup,
	 location=location.absolute,
	 color=bullColor,
	 textcolor=textColor,
	 transp=0
	 )

longCondition=bullCond or hiddenBullCond
//? osc[lbR] : na  
//hiddenBullCond
strategy.entry(id="RSIDivLE", long=true,  when=longCondition)


//Trailing StopLoss
////// Calculate trailing SL
/////////////////////////////////////////////////////
sl_val = sl_type == "ATR"      ? stopLoss * atr(atrLength) : 
         sl_type == "PERC" ? close * stopLoss / 100 : 0.00

trailing_sl = 0.0
trailing_sl :=   strategy.position_size>=1 ?  max(low  - sl_val, nz(trailing_sl[1])) :  na

//draw initil stop loss
//plot(strategy.position_size>=1 ? trailing_sl : na, color = color.blue , style=plot.style_linebr,  linewidth = 2, title = "stop loss")
//plot(trailing_sl, title="ATR Trailing Stop Loss", style=plot.style_linebr, linewidth=1, color=color.purple, transp=30)
//Trailing StopLoss
////// Calculate trailing SL
/////////////////////////////////////////////////////


//------------------------------------------------------------------------------
// Regular Bearish

// Osc: Lower High
oscLH = osc[lbR] < valuewhen(phFound, osc[lbR], 1) and _inRange(phFound[1])

// Price: Higher High
priceHH = high[lbR] > valuewhen(phFound, high[lbR], 1)

bearCond = plotBear and priceHH and oscLH and phFound

plot(
	 phFound ? osc[lbR] : na,
	 offset=-lbR,
	 title="Regular Bearish",
	 linewidth=2,
	 color=(bearCond ? bearColor : noneColor),
	 transp=0
	 )

plotshape(
	 bearCond ? osc[lbR] : na,
	 offset=-lbR,
	 title="Regular Bearish Label",
	 text=" Bear ",
	 style=shape.labeldown,
	 location=location.absolute,
	 color=bearColor,
	 textcolor=textColor,
	 transp=0
	 )

//------------------------------------------------------------------------------
// Hidden Bearish

// Osc: Higher High
oscHH = osc[lbR] > valuewhen(phFound, osc[lbR], 1) and _inRange(phFound[1])

// Price: Lower High
priceLH = high[lbR] < valuewhen(phFound, high[lbR], 1)

hiddenBearCond = plotHiddenBear and priceLH and oscHH and phFound

plot(
	 phFound ? osc[lbR] : na,
	 offset=-lbR,
	 title="Hidden Bearish",
	 linewidth=2,
	 color=(hiddenBearCond ? hiddenBearColor : noneColor),
	 transp=0
	 )

plotshape(
	 hiddenBearCond ? osc[lbR] : na,
	 offset=-lbR,
	 title="Hidden Bearish Label",
	 text=" H Bear ",
	 style=shape.labeldown,
	 location=location.absolute,
	 color=bearColor,
	 textcolor=textColor,
	 transp=0
	 )
longCloseCondition=crossover(osc,takeProfitRSILevel) or bearCond
strategy.close(id="RSIDivLE", comment="Close All="+tostring(close - strategy.position_avg_price, "####.##"), when= abs(strategy.position_size)>=1  and  sl_type == "NONE" and longCloseCondition)

//close all on stop loss
strategy.close(id="RSIDivLE", comment="TSL="+tostring(close - strategy.position_avg_price, "####.##"),  when=abs(strategy.position_size)>=1 and (sl_type == "PERC"   or sl_type == "ATR" ) and crossunder(close, trailing_sl)  )  //close<ema55 and rsi5Val<20 //ema34<ema55  //close<ema89

src1 = close, 
len6 = input(14, minval=1, title="RSI Length")
len7 = input(20, minval=1, title="EMA of RSI Length")
len8 = input(14,minval=1, title="Fast EMA")
up = rma(max(change(src1), 0), len6)
down = rma(-min(change(src1), 0), len6)
rsi = down == 0 ? 100 : up == 0 ? 0 : 100 - (100 / (1 + up / down))
emaRSI = ema(rsi,len7)
fastEmaRSI=ema(rsi,len8)

plot(emaRSI, title="EMA of RSI", linewidth=1, color=color.red)
plot(fastEmaRSI,title="Fast EMA of RSI", linewidth=1,color = color.lime)
band1 = hline(80, title="Upper Line", linewidth=1, color=color.red)
band0 = hline(20, title="Lower Line", linewidth=1, color=color.lime)
fill(band1, band0, color=color.purple)