
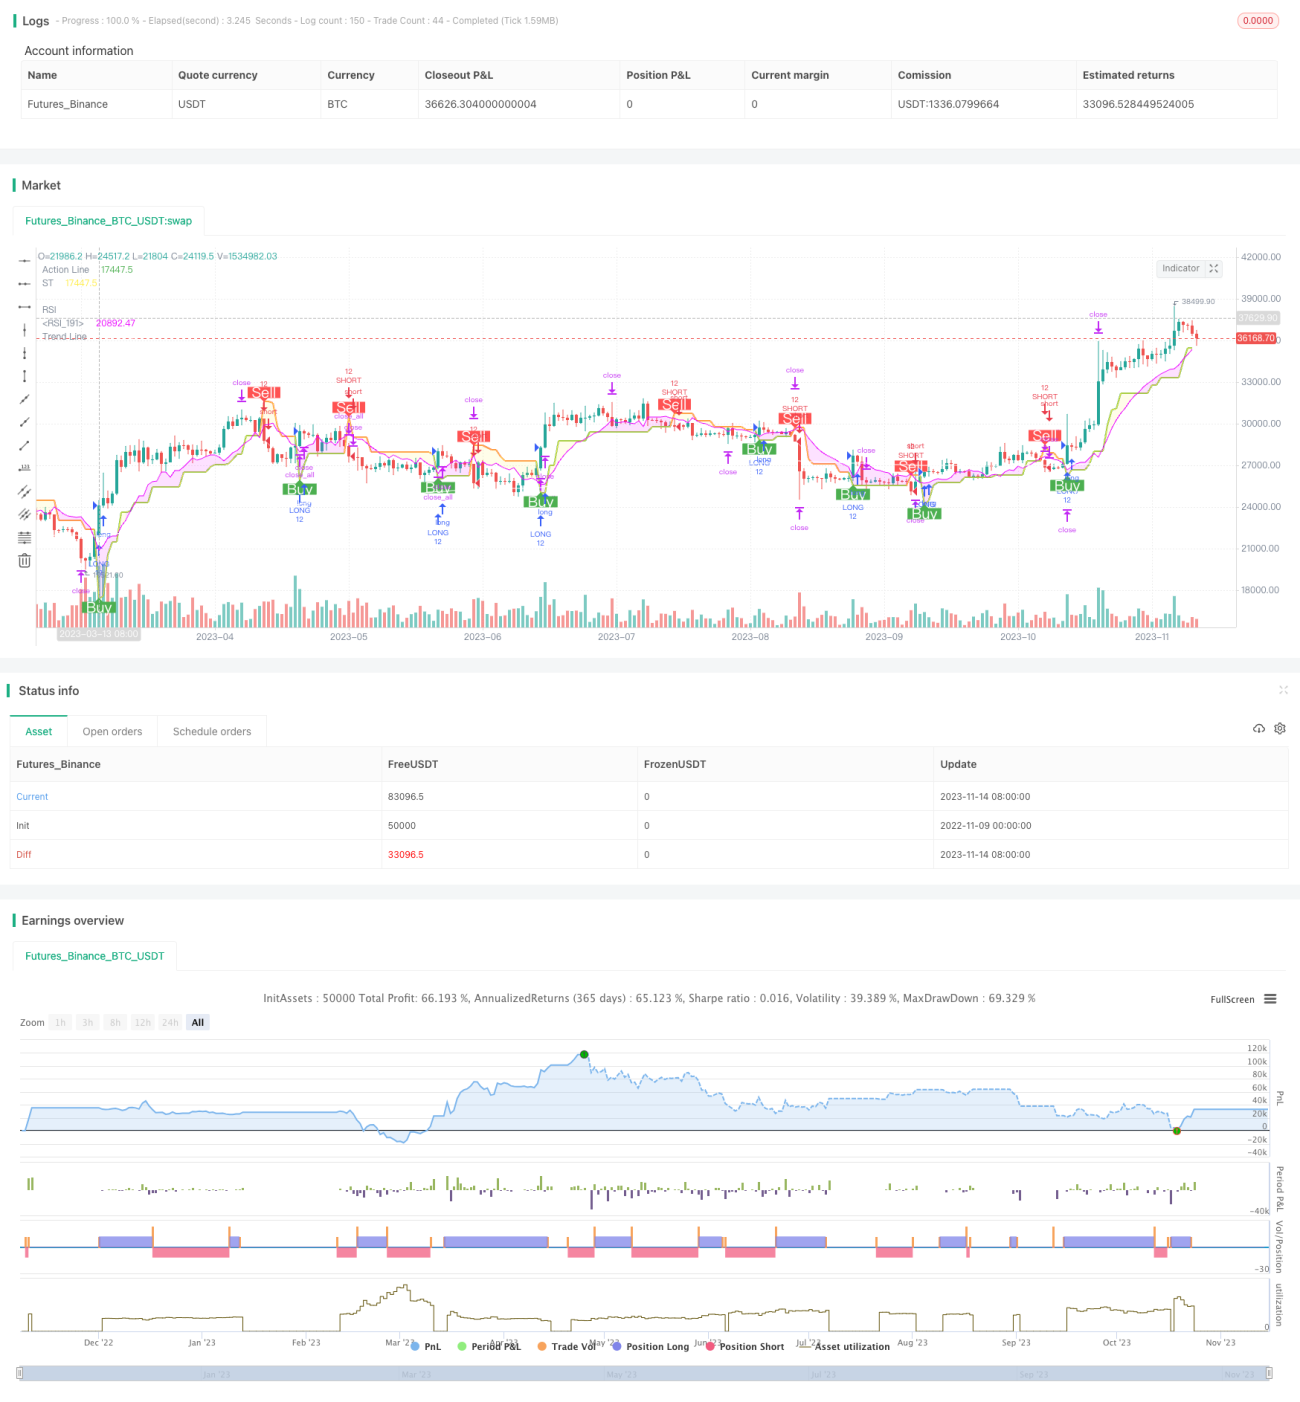
Strategi ini berdasarkan purata bergerak rata-rata rata-rata indeks yang kuat dan indeks yang agak kuat, merancang mekanisme penjejakan trend ganda, yang dapat menentukan trend pasaran dengan tepat, dan menetapkan titik berhenti kerugian yang munasabah. Strategi ini mempunyai ciri-ciri seperti titik berhenti dan mengikut trend, titik berhenti mengikut trend, penilaian trend ganda, dan sebagainya, yang dapat mengawal risiko perdagangan individu dengan berkesan, mendapatkan keuntungan super dalam keadaan trend.
Mengira purata bergerak super kuat untuk menentukan arah trend utama. Purata bergerak super kuat dapat menentukan arah trend dengan tepat dan memberikan titik masuk yang ideal.
Pengiraan indeks relatif kuat lemah ((RSI), sebagai penunjuk trend penilaian tambahan. Apabila RSI tinggi adalah kawasan membeli lebihan, menunjukkan trend pasaran lembu; Apabila RSI rendah adalah kawasan jual lebihan, menunjukkan trend pasaran beruang.
Apabila harga penutupan melintasi purata bergerak indeks yang sangat kuat, buat lebih banyak; apabila harga penutupan jatuh di bawah purata bergerak indeks yang sangat kuat, buat kosong.
Menetapkan titik henti rugi yang munasabah. Apabila melakukan overtime, gunakan purata bergerak lurus indeks super kuat sebagai titik henti rugi, dengan purata bergerak lurus indeks super kuat ditambah titik henti untung yang munasabah; apabila melakukan blanja, gunakan purata bergerak lurus indeks super kuat sebagai titik henti rugi, dengan purata bergerak lurus indeks super kuat dikurangkan titik henti untung yang munasabah.
Titik hentian akan bergerak mengikut pergerakan pasaran. Jika pasaran bergerak ke arah yang menguntungkan, garis hentian akan bergerak ke arah yang menguntungkan, memastikan keuntungan.
Apabila RSI selaras dengan arah rata-rata pergerakan indeks yang sangat kuat, ia menunjukkan bahawa tren sekarang adalah kuat, dan ketika itu strategi akan masuk. Apabila RSI tidak selaras dengan arah rata-rata pergerakan indeks yang sangat kuat, ia menunjukkan kemungkinan perubahan trend, dan ketika itu strategi akan keluar sementara.
Mekanisme penghakiman trend berganda dapat mengurangkan isyarat salah dan meningkatkan kestabilan strategi.
Titik hentian bergerak mengikut trend, untuk mengunci keuntungan maksimum dan mengelakkan kehilangan terlalu awal.
Penggunaan indikator RSI boleh menapis beberapa isyarat perdagangan yang lemah.
Menetapkan kedudukan berhenti yang munasabah untuk memaksimumkan keuntungan.
Parameter strategi boleh diselaraskan dan boleh dioptimumkan mengikut pelbagai jenis dan keadaan.
Strategi penarikan balik boleh dikawal dan mempunyai keupayaan pengurusan risiko yang kuat.
Sekiranya berlaku peristiwa yang tidak dijangka, seperti berita dasar yang penting, pasaran mungkin mengalami turun naik yang teruk, yang menyebabkan titik penangguhan ditembusi, menyebabkan kerugian yang lebih besar. Anda boleh melepaskan titik penangguhan dengan sewajarnya, atau keluar dari lapangan sebelum peristiwa risiko utama berlaku.
Tetapan parameter yang tidak betul boleh menyebabkan tetapan stop loss yang tidak munasabah, memperluaskan kerugian atau mengurangkan keuntungan. Kombinasi parameter terbaik boleh dicari dengan pengulangan berulang.
Pada peringkat peperangan multirumah, RSI dan indeks bergerak rata-rata yang sangat kuat mungkin berlaku, menyebabkan strategi menghasilkan isyarat perdagangan yang salah. Pada masa ini, anda boleh tidak berdagang sementara, menunggu trend yang jelas untuk masuk.
Mengoptimumkan parameter kitaran ATR agar lebih sesuai dengan ciri-ciri pelbagai jenis.
Mengoptimumkan parameter RSI untuk mencari keadaan yang lebih stabil dan boleh dipercayai untuk menentukan trend tambahan.
Berpadu dengan penunjuk lain, seperti tali pinggang Brin, KDJ, dan lain-lain, menetapkan asas masuk dan keluar yang lebih tepat.
Uji strategi penangguhan yang berbeza, seperti penangguhan pengesanan, penangguhan tangga, penangguhan garis bayangan, dan lain-lain, untuk mengoptimumkan tahap keuntungan.
Menyesuaikan strategi pengurusan kedudukan mengikut keputusan tinjauan balik untuk mengurangkan risiko perdagangan tunggal.
Strategi ini secara keseluruhannya mempunyai kestabilan yang kuat dan keuntungan yang berterusan. Mekanisme penilaian trend ganda dapat menyaring kebisingan dengan berkesan, strategi stop-loss dapat mengunci keuntungan dan mengawal risiko. Dengan terus mengoptimumkan parameter dan masuk dan keluar dari keadaan, strategi ini dapat memperoleh prestasi yang baik dalam pelbagai keadaan pasaran. Secara keseluruhannya, strategi ini boleh menjadi templat strategi yang baik untuk perdagangan kuantitatif, yang patut diteliti dan diterapkan.
/*backtest
start: 2022-11-09 00:00:00
end: 2023-11-15 00:00:00
period: 1d
basePeriod: 1h
exchanges: [{"eid":"Futures_Binance","currency":"BTC_USDT"}]
*/
//@version=5
//
// ▒▒▒▒▒▒▒▒▒▒▒▒▒▒▒▒▒▒▒▒▒▒▒▒▒▒▒▒▒▒▒▒▒▒▒▒▒▒▒▒▒▒▒▒▒▒▒▒▒▒▒▒▒▒▒▒▒▒▒▒▒▒▒▒▒▒▒▒▒▒▒▒▒▒▒▒▒▒▒▒▒▒▒▒▒▒▒▒▒▒▒▒▒▒▒▒▒▒▒▒▒▒▒▒▒▒▒▒▒▒▒▒▒▒
// -----------------------------------------------------------------------------
// Copyright 2019 Mauricio Pimenta | exit490
// SuperTrend with Trailing Stop Loss script may be freely distributed under the MIT license.
//
// Permission is hereby granted, free of charge,
// to any person obtaining a copy of this software and associated documentation files (the "Software"),
// to deal in the Software without restriction, including without limitation the rights to use, copy, modify, merge,
// publish, distribute, sublicense, and/or sell copies of the Software, and to permit persons to whom the Software is furnished to do so,
// subject to the following conditions:
//
// The above copyright notice and this permission notice shall be included in all copies or substantial portions of the Software.
//
// THE SOFTWARE IS PROVIDED "AS IS", WITHOUT WARRANTY OF ANY KIND,
// EXPRESS OR IMPLIED, INCLUDING BUT NOT LIMITED TO THE WARRANTIES OF MERCHANTABILITY,
// FITNESS FOR A PARTICULAR PURPOSE AND NONINFRINGEMENT. IN NO EVENT SHALL THE AUTHORS OR COPYRIGHT HOLDERS BE LIABLE FOR ANY CLAIM,
// DAMAGES OR OTHER LIABILITY, WHETHER IN AN ACTION OF CONTRACT, TORT OR OTHERWISE, ARISING FROM,
// OUT OF OR IN CONNECTION WITH THE SOFTWARE OR THE USE OR OTHER DEALINGS IN THE SOFTWARE.
//
// -----------------------------------------------------------------------------
//
// Authors: @exit490
// Revision: v1.0.0
// Date: 5-Aug-2019
//
// Description
// ===========
// SuperTrend is a moving stop and reversal line based on the volatility (ATR).
// The strategy will ride up your stop loss when price moviment 1%.
// The strategy will close your operation when the market price crossed the stop loss.
// The strategy will close operation when the line based on the volatility will crossed
//
// The strategy has the following parameters:
//
// INITIAL STOP LOSS - Where can isert the value to first stop.
// POSITION TYPE - Where can to select trade position.
// ATR PERIOD - To select number of bars back to execute calculation
// ATR MULTPLIER - To add a multplier factor on volatility
// BACKTEST PERIOD - To select range.
//
// -----------------------------------------------------------------------------
// Disclaimer:
// 1. I am not licensed financial advisors or broker dealers. I do not tell you
// when or what to buy or sell. I developed this software which enables you
// execute manual or automated trades multplierFactoriplierFactoriple trades using TradingView. The
// software allows you to set the criteria you want for entering and exiting
// trades.
// 2. Do not trade with money you cannot afford to lose.
// 3. I do not guarantee consistent profits or that anyone can make money with no
// effort. And I am not selling the holy grail.
// 4. Every system can have winning and losing streaks.
// 5. Money management plays a large role in the results of your trading. For
// example: lot size, account size, broker leverage, and broker margin call
// rules all have an effect on results. Also, your Take Profit and Stop Loss
// settings for individual pair trades and for overall account equity have a
// major impact on results. If you are new to trading and do not understand
// these items, then I recommend you seek education materials to further your
// knowledge.
//
// YOU NEED TO FIND AND USE THE TRADING SYSTEM THAT WORKS BEST FOR YOU AND YOUR
// TRADING TOLERANCE.
//
// I HAVE PROVIDED NOTHING MORE THAN A TOOL WITH OPTIONS FOR YOU TO TRADE WITH THIS PROGRAM ON TRADINGVIEW.
//
// I accept suggestions to improve the script.
// If you encounter any problems I will be happy to share with me.
// -----------------------------------------------------------------------------
//
// ▒▒▒▒▒▒▒▒▒▒▒▒▒▒▒▒▒▒▒▒▒▒▒▒▒▒▒▒▒▒▒▒▒▒▒▒▒▒▒▒▒▒▒▒▒▒▒▒▒▒▒▒▒▒▒▒▒▒▒▒▒▒▒▒▒▒▒▒▒▒▒▒▒▒▒▒▒▒▒▒▒▒▒▒▒▒▒▒▒▒▒▒▒▒▒▒▒▒▒▒▒▒▒▒▒▒▒▒▒▒▒▒▒▒ //
strategy(title='DEO SESSSION', shorttitle='DEO S', overlay=true, precision=8, calc_on_order_fills=true, calc_on_every_tick=true, backtest_fill_limits_assumption=0, default_qty_type=strategy.percent_of_equity, default_qty_value=100, initial_capital=1000, currency=currency.USD, linktoseries=true)
//
// ▒▒▒▒▒▒▒▒▒▒▒▒▒▒▒▒▒▒▒▒▒▒▒▒▒▒▒▒▒▒▒▒▒▒▒▒▒▒▒▒▒▒▒▒▒▒▒▒▒▒▒▒▒▒▒▒▒▒▒▒▒▒▒▒▒▒▒▒▒▒▒▒▒▒▒▒▒▒▒▒▒▒▒▒▒▒▒▒▒▒▒▒▒▒▒▒▒▒▒▒▒▒▒▒▒▒▒▒▒▒▒▒▒▒ //
// === BACKTEST RANGE ===
backTestSectionFrom = input(title='════════════ FROM ════════════', defval=true)
// selected dates
i_startTime = input(title="START FILTER", defval=timestamp("02 Jan 2023 00:00 +0000"), group="RISK MANAGEMENT", tooltip="Start date & time to begin searching for setups")
i_endTime = input(title="END FILTER", defval=timestamp("12 Dec 2100 00:00 +0000"), group="RISK MANAGEMENT", tooltip="End date & time to stop searching for setups")
afterStartDate = true
//
// ▒▒▒▒▒▒▒▒▒▒▒▒▒▒▒▒▒▒▒▒▒▒▒▒▒▒▒▒▒▒▒▒▒▒▒▒▒▒▒▒▒▒▒▒▒▒▒▒▒▒▒▒▒▒▒▒▒▒▒▒▒▒▒▒▒▒▒▒▒▒▒▒▒▒▒▒▒▒▒▒▒▒▒▒▒▒▒▒▒▒▒▒▒▒▒▒▒▒▒▒▒▒▒▒▒▒▒▒▒▒▒▒▒▒ //
parameterSection = input(title='══════════ STRATEGY ══════════', defval=true)
// === INPUT TO SELECT POSITION ===
positionType = input.string(defval='LONG', title='Position Type', options=['LONG', 'SHORT'])
// === INPUT TO SELECT INITIAL STOP LOSS
initialStopLossPercent = input.float(defval=3.0, minval=0.0, title='Initial Stop Loss')
// === INPUT TO SELECT BARS BACK
barsBack = input(title='ATR Period', defval=1)
// === INPUT TO SELECT MULTPLIER FACTOR
multplierFactor = input.float(title='ATR multplierFactoriplier', step=0.1, defval=3.0)
RSI = input.int(title='RSI', defval=7, minval=1, maxval=100)
calcSection = input(title='══════════ LOT CALC ══════════', defval=true)
accountBalance = input.float(title="ACCOUNT BALANCE", defval=250000, minval=1, group="INPUTS")
entryPrice = input.float(title="ENTRY PRICE", defval=100, minval=1, group="INPUTS")
slPrice = input.float(title="STOP LOSS PRICE", defval=100, minval=1, group="INPUTS")
riskPer = input.float(title="RISK USD", defval=1, minval=0.1, group="INPUTS")
lotSize = input.float(title="LOT SIZE", defval=10, minval=0.1, group="INPUTS")
RiskSize = riskPer
qtyLongTargetPrice = math.abs((RiskSize / ((entryPrice - slPrice) * syminfo.pointvalue)) / lotSize)
trendcSection = input(title='══════════ TREND LINE ══════════', defval=true)
// ema trend
tLen = input.int(200, minval=1, title="Trend Line")
tSrc = input(close, title="Source")
thisEma = ta.ema(tSrc, tLen)
plot(thisEma, title = "Trend Line",color=#ffffff)
MTSection = input(title='══════════ MT LOGIN ══════════', defval=true)
exchange = input.string(defval='MT5', title='EXCHANGE', options=['MT4', 'MT5'])
mtLogin= input.string(defval="", title='MT LOGIN', group = "mt")
mtPassword =input.string(defval='', title='MT PASSWORD', group = "mt")
mtServer =input.string(defval='', title='MT SERVER', group = "mt")
mtIsOn = input.string(defval='ON', title='STRATEGY ON', options=['ON', 'OFF'])
mtEntryMode = input.string(defval='CLOSE OPEN', title='ENTRY MODE', options=['CLOSE OPEN', 'OPEN'])
displaySection = input(title='══════════ DISPLAY LOGIN ══════════', defval=true)
displayTable = input(title="DISPLAY TABLE", defval=false, group = 'PRODUCTION', tooltip = "MAKES YOUR STRATEGY TRIGGER SLOWER")
//
// ▒▒▒▒▒▒▒▒▒▒▒▒▒▒▒▒▒▒▒▒▒▒▒▒▒▒▒▒▒▒▒▒▒▒▒▒▒▒▒▒▒▒▒▒▒▒▒▒▒▒▒▒▒▒▒▒▒▒▒▒▒▒▒▒▒▒▒▒▒▒▒▒▒▒▒▒▒▒▒▒▒▒▒▒▒▒▒▒▒▒▒▒▒▒▒▒▒▒▒▒▒▒▒▒▒▒▒▒▒▒▒▒▒▒ //
// LOGIC TO FIND DIRECTION WHEN THERE IS TREND CHANGE ACCORDING VOLATILITY
atr = multplierFactor * ta.atr(barsBack)
longStop = hl2 - atr
longStopPrev = nz(longStop[1], longStop)
longStop := close[1] > longStopPrev ? math.max(longStop, longStopPrev) : longStop
shortStop = hl2 + atr
shortStopPrev = nz(shortStop[1], shortStop)
shortStop := close[1] < shortStopPrev ? math.min(shortStop, shortStopPrev) : shortStop
direction = 1
direction := nz(direction[1], direction)
direction := direction == -1 and close > shortStopPrev ? 1 : direction == 1 and close < longStopPrev ? -1 : direction
longColor = color.blue
shortColor = color.blue
var valueToPlot = 0.0
var colorToPlot = color.white
if direction == 1
valueToPlot := longStop
colorToPlot := color.green
colorToPlot
else
valueToPlot := shortStop
colorToPlot := color.red
colorToPlot
//RSI
src = close
ep = 2 * RSI - 1
auc = ta.ema(math.max(src - src[1], 0), ep)
adc = ta.ema(math.max(src[1] - src, 0), ep)
x1 = (RSI - 1) * (adc * 70 / (100 - 70) - auc)
ub = x1 >= 0 ? src + x1 : src + x1 * (100 - 70) / 70
x2 = (RSI - 1) * (adc * 30 / (100 - 30) - auc)
lb = x2 >= 0 ? src + x2 : src + x2 * (100 - 30) / 30
//Affichage
plot(math.avg(ub, lb), color=color.white ,linewidth=1, title='RSI')
plot(valueToPlot == 0.0 ? na : valueToPlot, title='Action Line', linewidth=2, color=color.new(colorToPlot, 0))
plotshape(direction == 1 and direction[1] == -1 ? longStop : na, title='Buy', style=shape.labelup, location=location.absolute, size=size.normal, text='Buy', textcolor=color.new(color.white, 0), color=color.new(color.green, 0))
plotshape(direction == -1 and direction[1] == 1 ? shortStop : na, title='Sell', style=shape.labeldown, location=location.absolute, size=size.normal, text='Sell', textcolor=color.new(color.white, 0), color=color.new(color.red, 0))
p_ma1 = plot(valueToPlot, title = "ST", color = color.rgb(255, 236, 66))
p_ma2 = plot(math.avg(ub, lb), title = "RSI", color = color.rgb(234, 0, 255))
// Definitions: Trends
TrendUp1() =>
valueToPlot > math.avg(ub, lb)
TrendDown1() =>
valueToPlot < math.avg(ub, lb)
trendColor1 = TrendUp1() ? color.rgb(255, 236, 66, 85): TrendDown1() ? color.rgb(234, 0, 255, 85) : color.rgb(255, 255, 255, 85)
fill(p_ma1, p_ma2, color=trendColor1)
longCondition () =>
ta.crossover(close, valueToPlot)
shortCondition () =>
ta.crossunder(close, valueToPlot)
IsLongShort() =>
strategy.position_size != 0
getNewLotSize() =>
math.abs(riskPer / (close - valueToPlot))
// plot(getNewLotSize(), "new lot size")
newLotS = getNewLotSize()
alertManagement = str.tostring(exchange) + "," + str.tostring(mtLogin) + "," +str.tostring(mtPassword) + ","
alertManagement += str.tostring(mtServer) + "," + str.tostring(newLotS)
// alertManagement += str.tostring(stopLoss) + "," + str.tostring(applyingSL) + "," + str.tostring(applyTrailingStop) + ","
// alertManagement += str.tostring(exchange) + "," + str.tostring(exchangeAccount) + "," + str.tostring(slAmount) + "," + str.tostring(closeTpAmount) + ","
// alertManagement += str.tostring(exchangeLeverage) + "," + str.tostring(exchangeLeverageType) + ","
// alertManagement += str.tostring(mtLogin) + "," + str.tostring(mtPassword) + "," + str.tostring(mtServer) + "," + str.tostring(mtLot) + ","
// alertManagement += str.tostring(mtTp) + "," + str.tostring(mtTs) + "," + str.tostring(orderStrategy)
// alertManagement = "alertManagement"
myStop = 0.0
myTarget = 0.0
if (longCondition())
qtyLongTargetPrice := math.abs((RiskSize / ((close - valueToPlot) * syminfo.pointvalue)) / lotSize)
if IsLongShort()
strategy.close_all(comment = "close all entries")
strategy.entry("LONG", strategy.long, qty=12, comment="LONG", alert_message=alertManagement)
strategy.exit("TPL", "LONG", stop=valueToPlot, limit= close + (close - valueToPlot), comment="Target", alert_message=alertManagement)
if (shortCondition())
qtyLongTargetPrice := math.abs((RiskSize / ((close - valueToPlot) * syminfo.pointvalue)) / lotSize)
if IsLongShort()
strategy.close_all(comment = "close all entries")
strategy.entry("SHORT", strategy.short, qty=12, comment="SHORT", alert_message=alertManagement)
strategy.exit("TPS", "SHORT", stop=valueToPlot, limit= close + (close - valueToPlot), comment="Target", alert_message=alertManagement)
// Calculate the average profit per open trade
// avgProfit = profitSum / strategy.opentrades
getTotalProfit()=>
// Sum the profit of all open trades
profitSum = 0.0
for tradeNumber = 0 to strategy.closedtrades - 1
if strategy.closedtrades.profit(tradeNumber) > 0
profitSum += strategy.closedtrades.profit(tradeNumber)
result = profitSum
getTotalLoss()=>
// Sum the profit of all open trades
lossSum = 0.0
for tradeNumber = 0 to strategy.closedtrades - 1
if strategy.closedtrades.profit(tradeNumber) < 0
lossSum += strategy.closedtrades.profit(tradeNumber)
result = lossSum
maxLossRun()=>
lossRun = 0.0
currentMaxLoss = 0.0
for tradeNo = 0 to strategy.closedtrades - 1
if strategy.closedtrades.profit(tradeNo) < 0.0
lossRun += strategy.closedtrades.profit(tradeNo)
else
currentMaxLoss := math.min(currentMaxLoss, lossRun)
lossRun := 0.0
result = currentMaxLoss
TotalTrades() =>
strategy.closedtrades + strategy.opentrades
maxDrawDown() =>
maxDrawdown = 0.0
for tradeNo = 0 to strategy.closedtrades - 1
maxDrawdown := math.max(maxDrawdown, strategy.closedtrades.max_drawdown(tradeNo))
result = maxDrawdown
maxRunUp() =>
maxRunup = 0.0
for tradeNo = 0 to strategy.closedtrades - 1
maxRunup := math.max(maxRunup, strategy.closedtrades.max_runup(tradeNo))
result = maxRunup
tradeMaxLossReached() =>
maxLoss = 0.0
for tradeNo = 0 to strategy.closedtrades - 1
maxLoss := math.min(maxLoss, strategy.closedtrades.profit(tradeNo))
result = maxLoss
tradingStartTime() =>
strategy.closedtrades.entry_time(0)
daysBetween(t1, t2) => (t1 - t2) / 86400000
// Table
var InfoPanel = table.new(position = position.bottom_right, columns = 2, rows = 40, border_width = 1)
ftable(_table_id, _column, _row, _text, _bgcolor) =>
table.cell(_table_id, _column, _row, _text, 0, 0, color.black, text.align_right, text.align_center, size.small, _bgcolor)
tfString(int timeInMs) =>
// @function Produces a string corresponding to the input time in days, hours, and minutes.
// @param (series int) A time value in milliseconds to be converted to a string variable.
// @returns (string) A string variable reflecting the amount of time from the input time.
float s = timeInMs / 100000
float m = s / 60
float h = m / 60
float d = h / 24
float mo = d / 30.416
int tm = math.floor(m % 60)
int tr = math.floor(h % 24)
int td = math.floor(d % 30.416)
int tmo = math.floor(mo % 12)
int ys = math.floor(d / 365)
string result =
switch
d == 30 and tr == 10 and tm == 30 => "1M"
d == 7 and tr == 0 and tm == 0 => "1W"
=>
string yStr = ys ? str.tostring(ys) + "Y " : ""
string moStr = tmo ? str.tostring(tmo) + "M " : ""
string dStr = td ? str.tostring(td) + "D " : ""
string hStr = tr ? str.tostring(tr) + "H " : ""
string mStr = tm ? str.tostring(tm) + "min" : ""
yStr + moStr + dStr + hStr + mStr
if displayTable
maxLossRunInMarket= maxLossRun()
maxLossReached = tradeMaxLossReached()
tradeMaxLossReached = tradeMaxLossReached()
tradingInDays=daysBetween(time, tradingStartTime())
totalTrades=TotalTrades()