
Strategi ini menggabungkan penguraian siri masa, harga purata bertimbangan kuantiti, jalur Brin dan delta (OBV-PVT) 4 petunjuk teknikal untuk membuat penilaian multidimensi mengenai trend harga, overbought dan oversold.
Anda boleh mengoptimumkan strategi dengan menyesuaikan kitaran garis rata-rata, lebar Brin dan nisbah risiko-keuntungan, mengurangkan kekerapan dagangan dan meningkatkan kadar keuntungan dagangan tunggal.
Strategi ini menggunakan pelbagai alat analisis seperti pemisahan urutan masa, indikator Brin, indikator OBV, dan lain-lain, untuk mengenal pasti kejutan jangka pendek dan menangkap trend utama pasaran melalui kombinasi organik hubungan kuantitatif, ciri statistik dan penghakiman trend. Namun, terdapat risiko tertentu yang perlu disesuaikan dengan parameter untuk mencapai keadaan optimum.
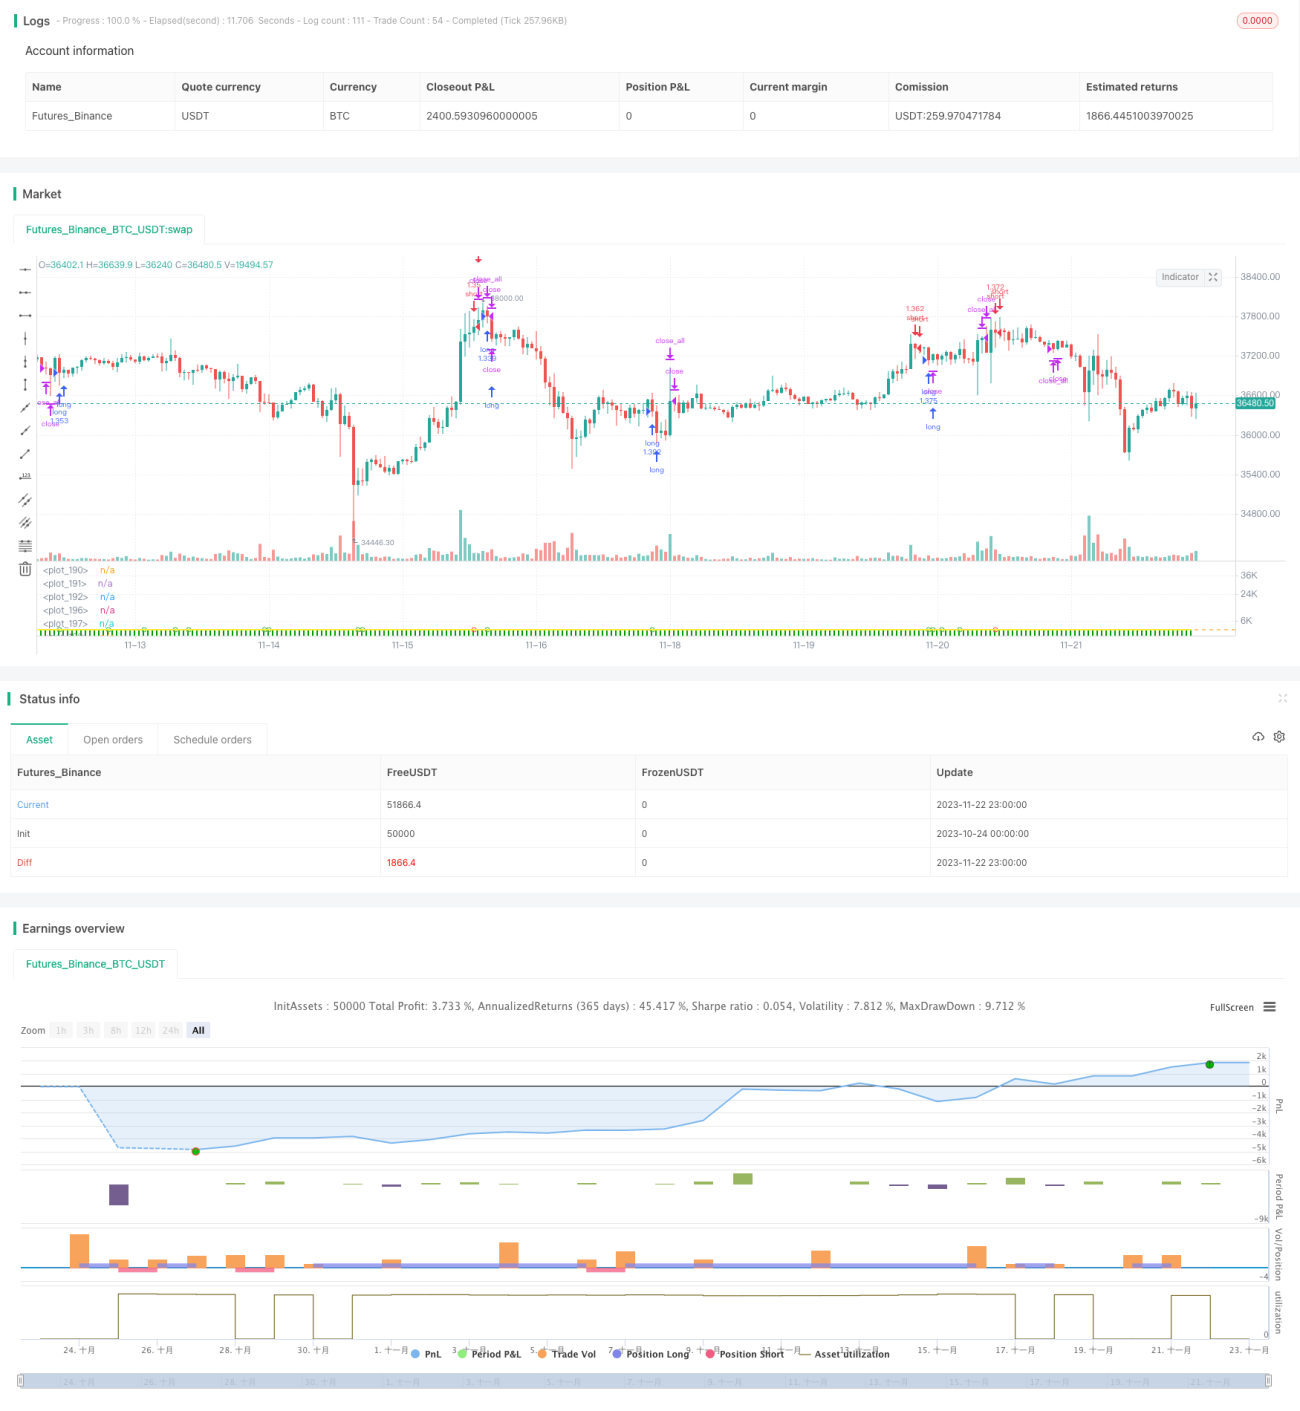
/*backtest
start: 2023-10-24 00:00:00
end: 2023-11-23 00:00:00
period: 1h
basePeriod: 15m
exchanges: [{"eid":"Futures_Binance","currency":"BTC_USDT"}]
*/
// This source code is subject to the terms of the Mozilla Public License 2.0 at https://mozilla.org/MPL/2.0/
//// This source code is subject to the terms of the Mozilla Public License 2.0 at https://mozilla.org/MPL/2.0/
// © oakwhiz and tathal
//@version=4
strategy("BBPBΔ(OBV-PVT)BB", default_qty_type=strategy.percent_of_equity, default_qty_value=100)
startDate = input(title="Start Date", type=input.integer,
defval=1, minval=1, maxval=31)
startMonth = input(title="Start Month", type=input.integer,
defval=1, minval=1, maxval=12)
startYear = input(title="Start Year", type=input.integer,
defval=2010, minval=1800, maxval=2100)
endDate = input(title="End Date", type=input.integer,
defval=31, minval=1, maxval=31)
endMonth = input(title="End Month", type=input.integer,
defval=12, minval=1, maxval=12)
endYear = input(title="End Year", type=input.integer,
defval=2021, minval=1800, maxval=2100)
// Normalize Function
normalize(_src, _min, _max) =>
// Normalizes series with unknown min/max using historical min/max.
// _src : series to rescale.
// _min, _min: min/max values of rescaled series.
var _historicMin = 10e10
var _historicMax = -10e10
_historicMin := min(nz(_src, _historicMin), _historicMin)
_historicMax := max(nz(_src, _historicMax), _historicMax)
_min + (_max - _min) * (_src - _historicMin) / max(_historicMax - _historicMin, 10e-10)
// STEP 2:
// Look if the close time of the current bar
// falls inside the date range
inDateRange = true
// Stop loss & Take Profit Section
sl_inp = input(2.0, title='Stop Loss %')/100
tp_inp = input(4.0, title='Take Profit %')/100
stop_level = strategy.position_avg_price * (1 - sl_inp)
take_level = strategy.position_avg_price * (1 + tp_inp)
icreturn = false
innercandle = if (high < high[1]) and (low > low[1])
icreturn := true
src = close
float change_src = change(src)
float i_obv = cum(change_src > 0 ? volume : change_src < 0 ? -volume : 0*volume)
float i_pvt = pvt
float result = change(i_obv - i_pvt)
float nresult = ema(normalize(result, -1, 1), 20)
length = input(20, minval=1)
mult = input(2.0, minval=0.001, maxval=50, title="StdDev")
basis = ema(nresult, length)
dev = mult * stdev(nresult, length)
upper = basis + dev
lower = basis - dev
bbr = (nresult - lower)/(upper - lower)
////////////////INPUTS///////////////////
lambda = input(defval = 1000, type = input.float, title = "Smoothing Factor (Lambda)", minval = 1)
leng = input(defval = 100, type = input.integer, title = "Filter Length", minval = 1)
srcc = close
///////////Construct Arrays///////////////
a = array.new_float(leng, 0.0)
b = array.new_float(leng, 0.0)
c = array.new_float(leng, 0.0)
d = array.new_float(leng, 0.0)
e = array.new_float(leng, 0.0)
f = array.new_float(leng, 0.0)
/////////Initialize the Values///////////
//for more details visit:
// https://asmquantmacro.com/2015/06/25/hodrick-prescott-filter-in-excel/
ll1 = leng-1
ll2 = leng-2
for i = 0 to ll1
array.set(a,i, lambda*(-4))
array.set(b,i, src[i])
array.set(c,i, lambda*(-4))
array.set(d,i, lambda*6 + 1)
array.set(e,i, lambda)
array.set(f,i, lambda)
array.set(d, 0, lambda + 1.0)
array.set(d, ll1, lambda + 1.0)
array.set(d, 1, lambda * 5.0 + 1.0)
array.set(d, ll2, lambda * 5.0 + 1.0)
array.set(c, 0 , lambda * (-2.0))
array.set(c, ll2, lambda * (-2.0))
array.set(a, 0 , lambda * (-2.0))
array.set(a, ll2, lambda * (-2.0))
//////////////Solve the optimization issue/////////////////////
float r = array.get(a, 0)
float s = array.get(a, 1)
float t = array.get(e, 0)
float xmult = 0.0
for i = 1 to ll2
xmult := r / array.get(d, i-1)
array.set(d, i, array.get(d, i) - xmult * array.get(c, i-1))
array.set(c, i, array.get(c, i) - xmult * array.get(f, i-1))
array.set(b, i, array.get(b, i) - xmult * array.get(b, i-1))
xmult := t / array.get(d, i-1)
r := s - xmult*array.get(c, i-1)
array.set(d, i+1, array.get(d, i+1) - xmult * array.get(f, i-1))
array.set(b, i+1, array.get(b, i+1) - xmult * array.get(b, i-1))
s := array.get(a, i+1)
t := array.get(e, i)
xmult := r / array.get(d, ll2)
array.set(d, ll1, array.get(d, ll1) - xmult * array.get(c, ll2))
x = array.new_float(leng, 0)
array.set(x, ll1, (array.get(b, ll1) - xmult * array.get(b, ll2)) / array.get(d, ll1))
array.set(x, ll2, (array.get(b, ll2) - array.get(c, ll2) * array.get(x, ll1)) / array.get(d, ll2))
for j = 0 to leng-3
i = leng-3 - j
array.set(x, i, (array.get(b,i) - array.get(f,i)*array.get(x,i+2) - array.get(c,i)*array.get(x,i+1)) / array.get(d, i))
//////////////Construct the output///////////////////
o5 = array.get(x,0)
////////////////////Plottingd///////////////////////
TimeFrame = input('1', type=input.resolution)
start = security(syminfo.tickerid, TimeFrame, time)
//------------------------------------------------
newSession = iff(change(start), 1, 0)
//------------------------------------------------
vwapsum = 0.0
vwapsum := iff(newSession, o5*volume, vwapsum[1]+o5*volume)
volumesum = 0.0
volumesum := iff(newSession, volume, volumesum[1]+volume)
v2sum = 0.0
v2sum := iff(newSession, volume*o5*o5, v2sum[1]+volume*o5*o5)
myvwap = vwapsum/volumesum
dev2 = sqrt(max(v2sum/volumesum - myvwap*myvwap, 0))
Coloring=close>myvwap?color.green:color.red
av=myvwap
showBcol = input(false, type=input.bool, title="Show barcolors")
showPrevVWAP = input(false, type=input.bool, title="Show previous VWAP close")
prevwap = 0.0
prevwap := iff(newSession, myvwap[1], prevwap[1])
nprevwap= normalize(prevwap, 0, 1)
l1= input(20, minval=1)
src2 = close
mult1 = input(2.0, minval=0.001, maxval=50, title="StdDev")
basis1 = sma(src2, l1)
dev1 = mult1 * stdev(src2, l1)
upper1 = basis1 + dev1
lower1 = basis1 - dev1
bbr1 = (src - lower1)/(upper1 - lower1)
az = plot(bbr, "Δ(OBV-PVT)", color.rgb(0,153,0,0), style=plot.style_columns)
bz = plot(bbr1, "BB%B", color.rgb(0,125,125,50), style=plot.style_columns)
fill(az, bz, color=color.white)
deltabbr = bbr1 - bbr
oneline = hline(1)
twoline = hline(1.2)
zline = hline(0)
xx = input(.3)
yy = input(.7)
zz = input(-1)
xxx = hline(xx)
yyy = hline(yy)
zzz = hline(zz)
fill(oneline, twoline, color=color.red, title="Sell Zone")
fill(yyy, oneline, color=color.orange, title="Slightly Overbought")
fill(yyy, zline, color=color.white, title="DO NOTHING ZONE")
fill(zzz, zline, color=color.green, title="GO LONG ZONE")
l20 = crossover(deltabbr, 0)
l30 = crossunder(deltabbr, 0)
l40 = crossover(o5, 0)
l50 = crossunder(o5, 0)
z1 = bbr1 >= 1
z2 = bbr1 < 1 and bbr1 >= .7
z3 = bbr1 < .7 and bbr1 >= .3
z4 = bbr1 < .3 and bbr1 >= 0
z5 = bbr1 < 0
a1 = bbr >= 1
a2 = bbr < 1 and bbr >= .7
a4 = bbr < .3 and bbr >= 0
a5 = bbr < 0
b4 = deltabbr < .3 and deltabbr >= 0
b5 = deltabbr < 0
c4 = o5 < .3 and o5 >= 0
c5 = o5 < 0
b1 = deltabbr >= 1
b2 = deltabbr < 1 and o5 >= .7
c1 = o5 >= 1
c2 = o5 < 1 and o5 >= .7
///
n = input(16,"Period")
H = highest(hl2,n)
L = lowest(hl2,n)
hi = H[1]
lo = L[1]
up = high>hi
dn = low<lo
lowerbbh = lowest(10)[1]
bbh = (low == open ? open < lowerbbh ? open < close ? close > ((high[1] - low[1]) / 2) + low[1] :na : na : na)
plot(normalize(av,-1,1), linewidth=2, title="Trendline", color=color.yellow)
long5 = close < av and av[0] > av[1]
sell5 = close > av
cancel = false
if open >= high[1]
cancel = true
long = (long5 or z5 or a5) and (icreturn or bbh or up)
sell = ((z1 or a1) or (l40 and l20)) and (icreturn or dn) and (c1 or b1)
short = ((z1 or z2 or a1 or sell5) and (l40 or l20)) and icreturn
buy= (z5 or z4 or a5 or long5) and (icreturn or dn)
plotshape(long and not sell ? -0.5 : na, title="Long", location=location.absolute, style=shape.circle, size=size.tiny, color=color.green, transp=0)
plotshape(short and not sell? 1 : na, title="Short", location=location.absolute, style=shape.circle, size=size.tiny, color=color.red, transp=0)
if (inDateRange)
strategy.entry("long", true, when = long )
if (inDateRange) and (strategy.position_size > 0)
strategy.close_all(when = sell or cancel)
if (inDateRange)
strategy.entry("short", false, when = short )
if (inDateRange) and (strategy.position_size < 0)
strategy.close_all(when = buy)