Strategi tangkapan terbalik


Tarikh penciptaan: 2023-11-24 16:43:25 Akhirnya diubah suai: 2023-11-24 16:43:25
Salin: 0 Bilangan klik: 676
1
fokus pada
1617
Pengikut

Strategi tangkapan terbalik

Gambaran keseluruhan

Strategi tangkapan reverse adalah strategi perdagangan reverse yang menggunakan garis Brin yang menunjukkan kadar turun naik dan RSI yang menunjukkan momentum. Ia menetapkan saluran Brin dan garis RSI yang lebih baik dan lebih baik sebagai isyarat untuk mencari peluang untuk berdagang apabila arah trend berubah.

Prinsip Strategi

Strategi ini menggunakan garis Brin sebagai penunjuk teknikal utama, ditambah dengan penunjuk dinamik seperti RSI untuk mengesahkan isyarat perdagangan. Logiknya ialah:

  1. Untuk menilai arah trend kitaran besar, tentukan apakah ia adalah bullish atau bearish. Gunakan EMA 50 hari dan EMA 21 hari untuk menilai.
  2. Dalam trend turun, apabila harga naik menembusi Bollinger Downs, dan RSI baru sahaja bangkit dari kawasan oversold, bentuk garpu emas muncul, menunjukkan bahawa kawasan oversold telah mencapai dasar, dan dianggap sebagai isyarat beli.
  3. Dalam trend menaik, apabila harga jatuh menembusi Bollinger Uptrend, dan RSI baru sahaja jatuh dari kawasan overbought, bentuk garpu mati muncul, yang menunjukkan bahawa kawasan overbought telah mula berpatah balik, yang dianggap sebagai isyarat menjual.
  4. Isyarat beli dan jual di atas mesti dipenuhi pada masa yang sama, untuk mengelakkan isyarat palsu.

Analisis kelebihan

Strategi ini mempunyai kelebihan berikut:

  1. Gabungan penunjuk kadar turun naik dan penunjuk momentum, isyarat lebih dipercayai.
  2. Perdagangan berbalik adalah kurang berisiko dan sesuai untuk operasi garis pendek.
  3. Peraturan pemrograman jelas dan mudah untuk melakukan perdagangan automatik.
  4. Berkongsi dengan perdagangan trend, anda boleh mengelakkan perdagangan yang tidak teratur di pasaran yang bergolak.

Analisis risiko

Strategi ini juga mempunyai risiko:

  1. Saluran Brinline merangkumi risiko penembusan isyarat palsu yang memerlukan penapisan RSI.
  2. Ia adalah risiko kegagalan pembalikan dan perlu dihentikan dengan segera.
  3. Tidak pasti masa berpatah balik, risiko masuk awal atau kehilangan tempat terbaik.

Untuk risiko di atas, anda boleh menetapkan kedudukan hentian kerugian untuk mengawal lubang risiko, sambil mengoptimumkan parameter, menyesuaikan kitaran garis putaran atau parameter RSI.

Arah pengoptimuman

Strategi ini boleh dioptimumkan dengan cara berikut:

  1. Mengoptimumkan parameter Brin, menyesuaikan panjang kitaran dan saiz perbezaan piawai, mencari kombinasi parameter yang optimum.
  2. Mengoptimumkan kitaran purata bergerak untuk menentukan panjang kitaran terbaik untuk menilai trend.
  3. Menyesuaikan parameter RSI untuk mencari julat zon overbought dan oversold yang terbaik.
  4. Menambah gabungan penunjuk lain, seperti KDJ, MACD, dan lain-lain, untuk memperkaya alasan kemasukan sistem.
  5. Menambah algoritma pembelajaran mesin, menggunakan teknologi AI untuk mencari parameter terbaik secara automatik.

ringkaskan

Strategi menangkap reverse secara keseluruhan adalah strategi perdagangan garis pendek yang lebih baik. Ia menggabungkan penilaian trend dan isyarat pembalikan, yang dapat menyaring isyarat palsu dari pasaran yang bergolak, yang dapat mengelakkan pegangan terhadap trend di pasaran yang sedang tren, dan risiko dapat dikawal. Dengan terus mengoptimumkan parameter dan model, anda dapat memperoleh kesan strategi yang lebih baik.
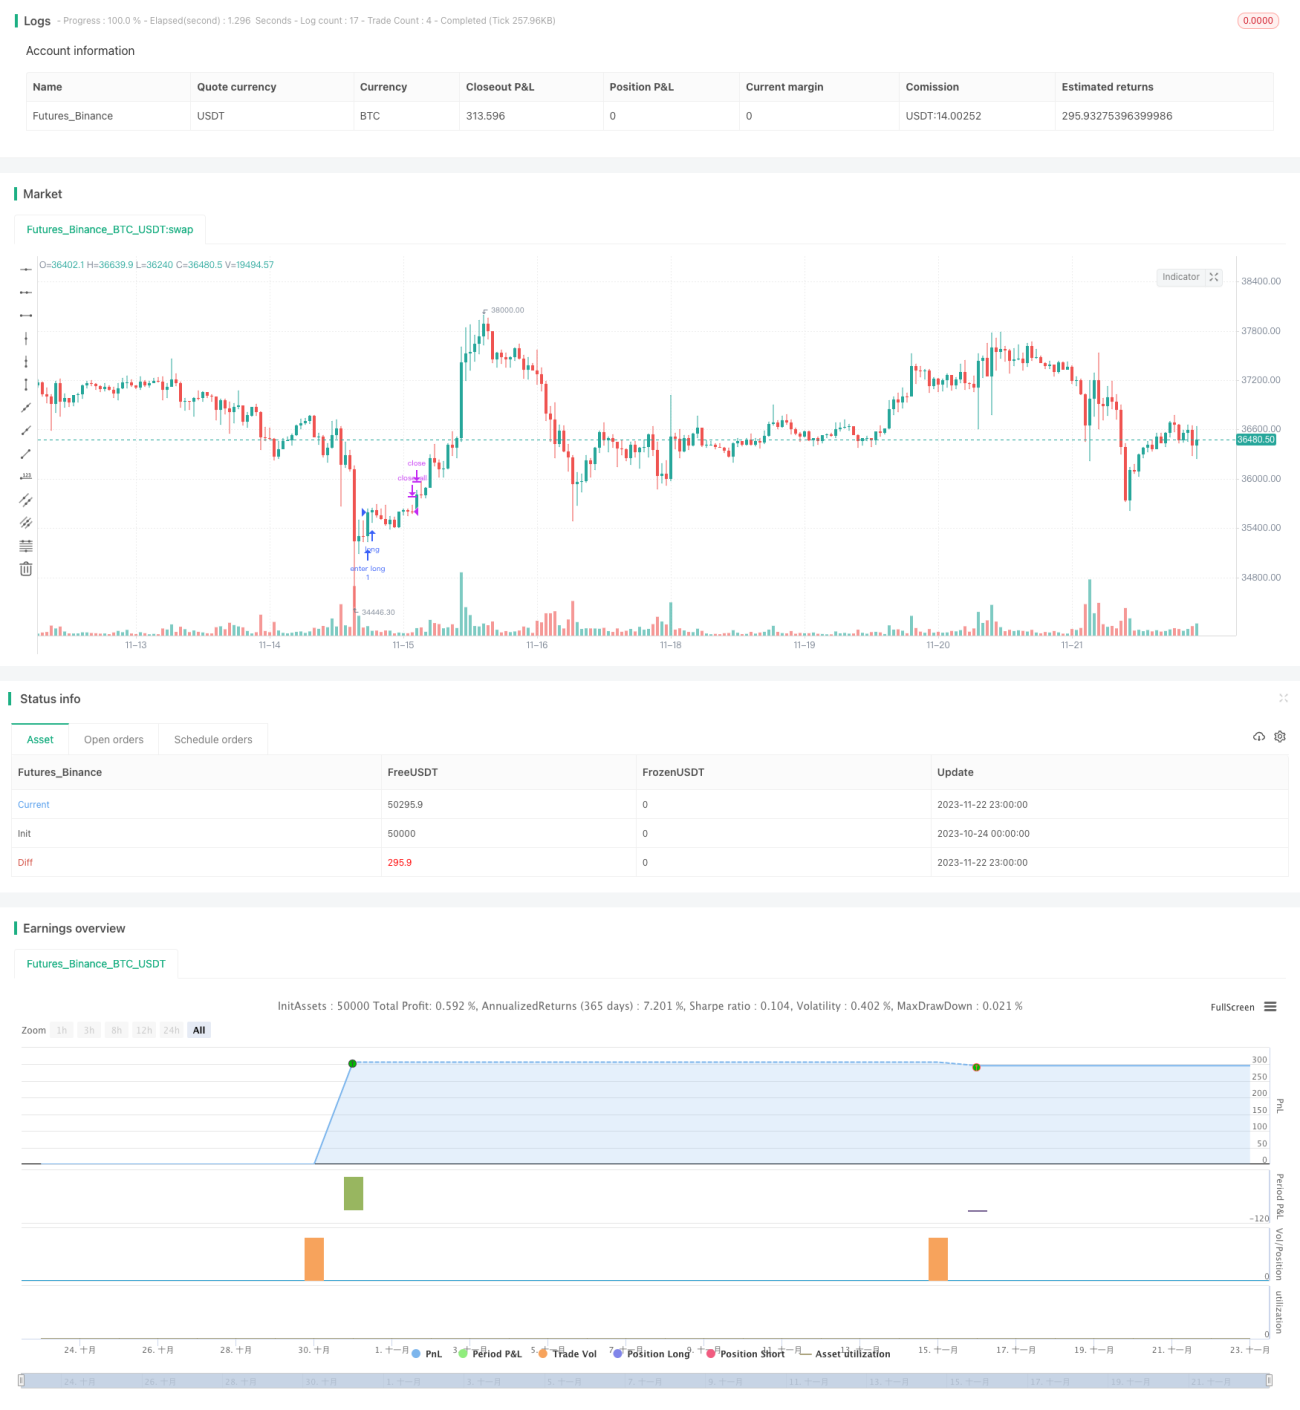
Kod sumber strategi
/*backtest
start: 2023-10-24 00:00:00
end: 2023-11-23 00:00:00
period: 1h
basePeriod: 15m
exchanges: [{"eid":"Futures_Binance","currency":"BTC_USDT"}]
*/

// This is an Open source work. Please do acknowledge in case you want to reuse whole or part of this code.
// Please see the documentation to know the details about this.

//@version=5
strategy('Strategy:Reversal-Catcher', shorttitle="Reversal-Catcher", overlay=true , currency=currency.NONE, initial_capital=100000)

// Inputs
src = input(close, title="Source (close, high, low, open etc.")

BBlength = input.int(defval=20, minval=1,title="Bollinger Period Length, default 20")
BBmult = input.float(defval=1.5, minval=1.0, maxval=4, step=0.1, title="Bollinger Bands Standard Deviation, default is 1.5")

fastMovingAvg = input.int(defval=21, minval=5,title="Fast Exponential Moving Average, default 21", group = "Trends")
slowMovingAvg = input.int(defval=50, minval=8,title="Slow Exponential Moving Average, default 50", group = "Trends")

rsiLenght = input.int(defval=14, title="RSI Lenght, default 14", group = "Momentum")
overbought = input.int(defval=70, title="Overbought limit (RSI), default 70", group = "Momentum")
oversold = input.int(defval=30, title="Oversold limit (RSI), default 30", group = "Momentum")

hide = input.bool(defval=true, title="Hide all plots and legends from the chart (default: true)")


// Trade related
tradeType = input.string(defval='Both', group="Trade settings", title="Trade Type", options=['Both', 'TrendFollowing', 'Reversal'], tooltip="Consider all types of trades? Or only Trend Following or only Reversal? (default: Both).")
endOfDay = input.int(defval=1500, title="Close all trades, default is 3:00 PM, 1500 hours (integer)", group="Trade settings")
mktAlwaysOn = input.bool(defval=false, title="Markets that never closed (Crypto, Forex, Commodity)", tooltip="Some markers never closes. For those cases, make this checked. (Default: off)", group="Trade settings")


// Utils
annotatePlots(txt, val, hide) => 
    if (not hide)
        var l1 = label.new(bar_index, val, txt, style=label.style_label_left, size = size.tiny, textcolor = color.white, tooltip = txt)
        label.set_xy(l1, bar_index, val)

/////////////////////////////// Indicators /////////////////////
vwap = ta.vwap(src)
plot(hide ? na : vwap, color=color.purple, title="VWAP", style = plot.style_line)
annotatePlots('VWAP', vwap, hide)

// Bollinger Band of present time frame
[BBbasis, BBupper, BBlower] = ta.bb(src, BBlength, BBmult)
p1 = plot(hide ? na : BBupper, color=color.blue,title="Bollinger Bands Upper Line")
p2 = plot(hide ? na : BBlower, color=color.blue,title="Bollinger Bands Lower Line")
p3 = plot(hide ? na : BBbasis, color=color.maroon,title="Bollinger Bands Width", style=plot.style_circles, linewidth = 1)
annotatePlots('BB-Upper', BBupper, hide)
annotatePlots('BB-Lower', BBlower, hide)
annotatePlots('BB-Base(20-SMA)', BBbasis, hide)

// RSI
rsi = ta.rsi(src, rsiLenght)

// Trend following
ema50 = ta.ema(src, slowMovingAvg)
ema21 = ta.ema(src, fastMovingAvg)
annotatePlots('21-EMA', ema21, hide)
annotatePlots('50-EMA', ema50, hide)


// Trend conditions
upTrend = ema21 > ema50 
downTrend = ema21 < ema50


// Condition to check Special Entry: HH_LL
// Long side:
hhLLong = barstate.isconfirmed and (low > low[1]) and (high > high[1]) and (close > high[1])
hhLLShort = barstate.isconfirmed and (low < low[1]) and (high < high[1]) and (close < low[1])

longCond =  barstate.isconfirmed and (high[1] < BBlower[1]) and (close > BBlower) and (close < BBupper) and hhLLong and ta.crossover(rsi, oversold) and downTrend
shortCond = barstate.isconfirmed and (low[1] > BBupper[1]) and (close < BBupper) and (close > BBlower) and hhLLShort and ta.crossunder(rsi, overbought) and upTrend

// Trade execute
h = hour(time('1'), syminfo.timezone)
m = minute(time('1'), syminfo.timezone)
hourVal = h * 100 + m
totalTrades = strategy.opentrades + strategy.closedtrades
if (mktAlwaysOn or (hourVal < endOfDay))
    // Entry
    var float sl = na
    var float target = na
    if (longCond)
        strategy.entry("enter long", strategy.long, 1, limit=na, stop=na, comment="Long[E]")
        sl := low[1]
        target := high >= BBbasis ? BBupper : BBbasis
        alert('Buy:' + syminfo.ticker + ' ,SL:' + str.tostring(math.floor(sl)) + ', Target:' + str.tostring(target), alert.freq_once_per_bar)
    if (shortCond)
        strategy.entry("enter short", strategy.short, 1, limit=na, stop=na, comment="Short[E]")
        sl := high[1]
        target := low <= BBbasis ? BBlower : BBbasis
        alert('Sell:' + syminfo.ticker + ' ,SL:' + str.tostring(math.floor(sl)) + ', Target:' + str.tostring(target), alert.freq_once_per_bar)

    // Exit: target or SL
    if ((close >= target) or (close <= sl))
        strategy.close("enter long", comment=close < sl ? "Long[SL]" : "Long[T]")
    if ((close <= target) or (close >= sl))
        strategy.close("enter short", comment=close > sl ? "Short[SL]" : "Short[T]")
else if (not mktAlwaysOn)
    // Close all open position at the end if Day
    strategy.close_all(comment = "EoD[Exit]", alert_message = "EoD Exit", immediately = true)