Strategi mengikut arah aliran berdasarkan stop loss EMA dan ATR

Gambaran keseluruhan
Strategi ini menggunakan golden cross EMA rata-rata untuk menghasilkan isyarat perdagangan, iaitu isyarat beli apabila melintasi garis EMA perlahan pada garis EMA cepat, dan isyarat jual apabila melintasi garis EMA perlahan di bawah garis EMA cepat. Strategi ini merupakan strategi pengesanan trend yang tipikal. Pada masa yang sama, strategi ini menggunakan indikator ATR untuk menetapkan stop loss yang dinamik, dan mengawal risiko sambil memastikan keuntungan.
Prinsip Strategi
- Tentukan kitaran purata EMA pantas 13 dan kitaran purata EMA perlahan 48.
- Apabila garis EMA cepat melintasi garis EMA perlahan, ia menghasilkan isyarat beli; apabila garis EMA cepat melintasi garis EMA perlahan, ia menghasilkan isyarat jual.
- Fungsi ta.crossover dan ta.crossunder untuk menentukan sama rata garpu linear.
- Menggunakan indikator ATR untuk mengira titik berhenti dinamik, 1.5 kali ATR dari jarak dekat.
- Tanda-tanda perdagangan dan titik-titik berhenti ditunjukkan secara visual melalui perubahan warna, tanda jual beli, dan garis berhenti.
Analisis kelebihan strategi
- Fork mati emas berdasarkan garis rata-rata EMA menghasilkan isyarat, mengelakkan kehilangan trend utama pasaran, dan memperoleh keuntungan yang cukup besar.
- ATR dinamik menjejaki hentian kerugian, kedua-dua memastikan keuntungan yang mencukupi, dan mengawal risiko penarikan balik, dan keuntungan risiko keseluruhan adalah seimbang.
- Tampilan isyarat dan stop loss yang intuitif, mudah dikendalikan, sesuai untuk kebanyakan orang.
- Lebih sedikit parameter yang boleh disesuaikan, lebih mudah dipelajari dan dioptimumkan.
Analisis risiko strategi
- Ia boleh menyebabkan kejatuhan yang tidak dijangka.
- Isyarat tidak aktif mungkin berlaku dalam keadaan gegaran.
- Tetapan parameter yang tidak betul boleh menyebabkan terlalu keras memasuki padang atau terlalu longgar.
- Parameter EMA dan ATR perlu dioptimumkan dengan sewajarnya.
Penyelesaian:
- Peningkatan ATR boleh dikurangkan dengan sewajarnya untuk memastikan bahawa terdapat penampan terhadap paras terendah.
- Mekanisme pengesahan selepas isyarat dihasilkan boleh dipertimbangkan, seperti harga sebelum penembusan tertinggi.
- Ia disyorkan untuk mengoptimumkan parameter dengan mempertimbangkan pelbagai keadaan pasaran secara menyeluruh.
Arah pengoptimuman strategi
- Anda boleh menguji kombinasi parameter yang berbeza untuk mencari parameter terbaik.
- Anda boleh mempertimbangkan untuk menapis isyarat dengan penunjuk lain, seperti penunjuk jumlah lalu lintas, penunjuk kadar turun naik, dan sebagainya, untuk meningkatkan kualiti isyarat.
- Parameter EMA boleh disesuaikan mengikut trend peringkat besar untuk menangkap trend utama.
- Anda boleh mempertimbangkan untuk menyesuaikan ATR Stop Loss Multiple secara dinamik, dan meluaskan jangkauan Stop Loss dalam keadaan trend.
- Parameter pengoptimuman penyesuaian diri boleh digabungkan dengan algoritma pembelajaran mesin.
ringkaskan
Strategi ini secara keseluruhannya lebih mudah digunakan, berdasarkan EMA rata-rata menghasilkan isyarat, berturut-turut, ditambah dengan penunjuk ATR untuk mengesan hentikan, boleh mengawal risiko dengan berkesan. Walaupun akan ada isyarat palsu, tetapi keupayaan untuk menangkap trend utama yang kuat, keuntungan yang lebih stabil, sesuai sebagai salah satu strategi asas untuk perdagangan kuantitatif.
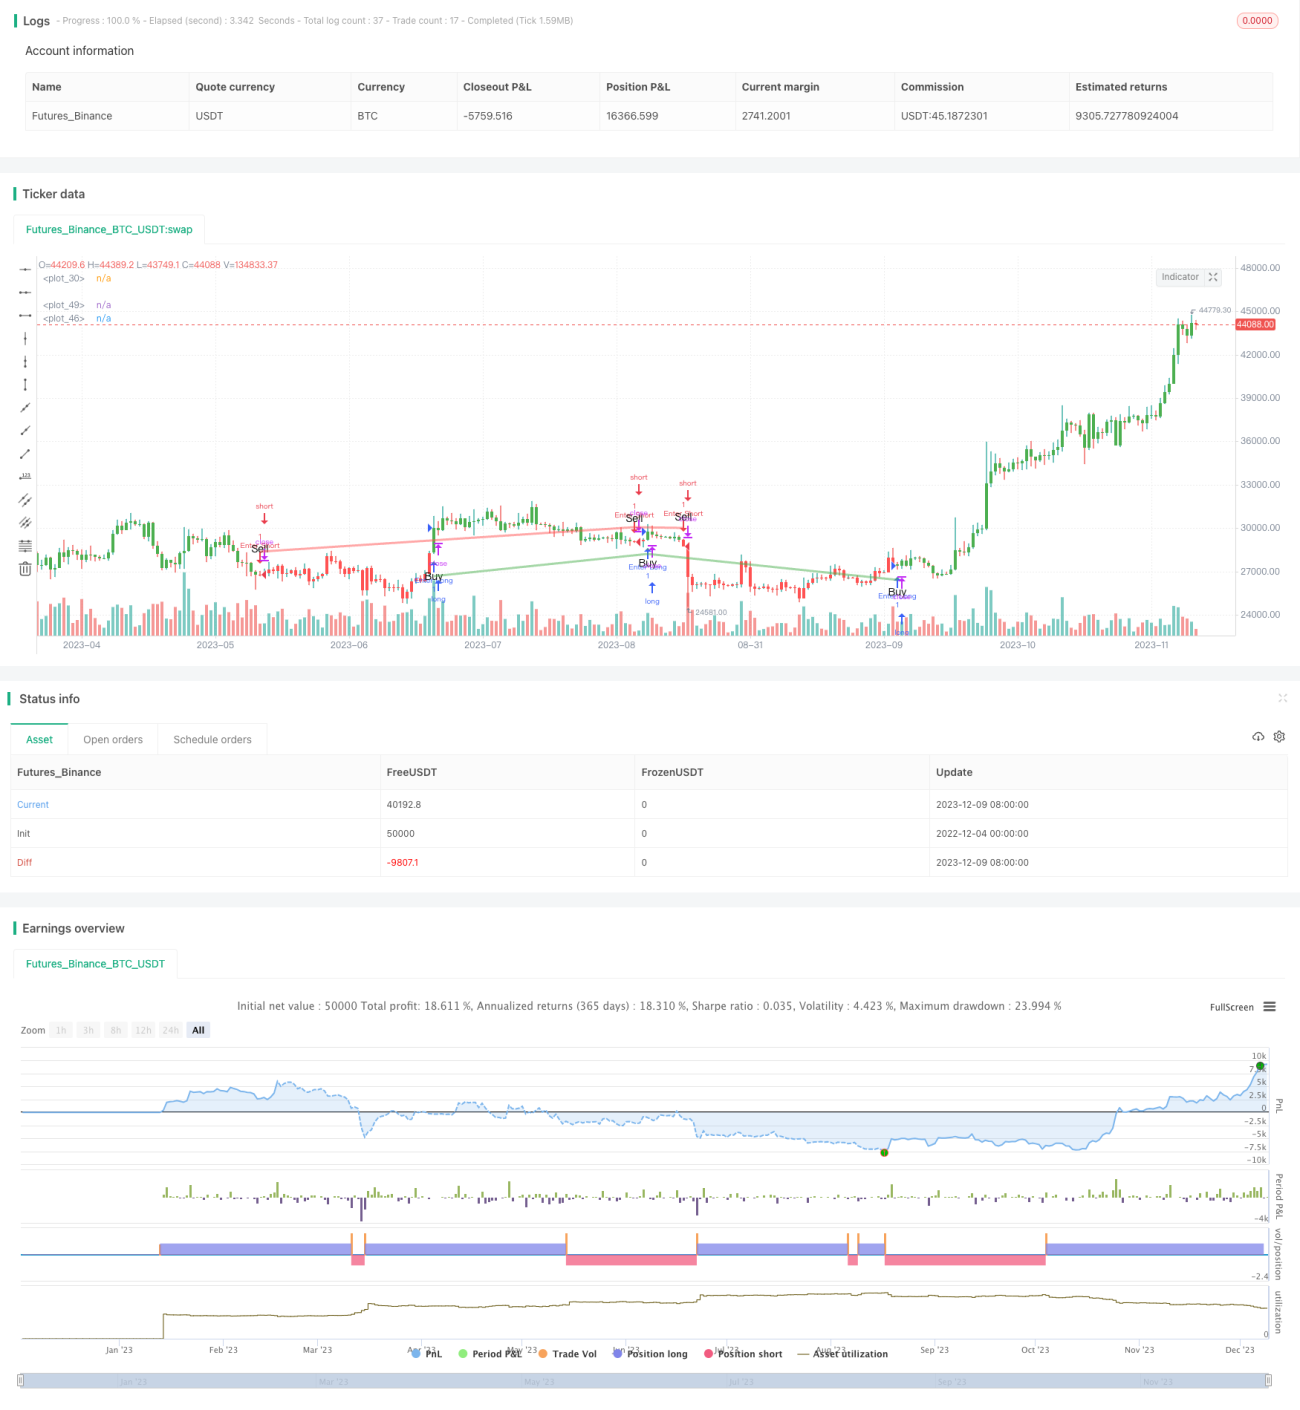
/*backtest
start: 2022-12-04 00:00:00
end: 2023-12-10 00:00:00
period: 1d
basePeriod: 1h
exchanges: [{"eid":"Futures_Binance","currency":"BTC_USDT"}]
*/

// This source code is subject to the terms of the Mozilla Public License 2.0 at https://mozilla.org/MPL/2.0/
// © byee322

/// This strategy uses the EMA to generate buy and sell signals with a 1.5x ATR stop loss- 1