Strategi Perdagangan Sisihan Volatiliti SMA

Strategi Perdagangan Sisihan Volatiliti SMA
Gambaran Keseluruhan Strategi
Strategi ini menggunakan purata bergerak mudah dan beberapa pengiraan matematik untuk menentukan titik beli/jual. Kami menggunakan 100 hari SMA sebagai garis dasar. Jika harga tutup berada di bawah garis, kami memilih titik bukaan berdasarkan seberapa rendah ia berada di bawah garis, nilai ini (<<<<<<<<<<<<<<<<<<<<<<<<<<<<<<<<<<<<<<<<<<<<<<<<<<<<<<<<<<<<<<<<<<<<<<<<<<<<<<<<<<<<<<<<<<<<<<<<<<<<<<<<<<<<<<<<<<<<<<<<<<<<<<<<<<<<<<<<<<<<<<<<<<<<<<<<<<<<<<<<<<<<<<<<<<<<<<<<<<<<<<<<<<<<<<<<<<<<<<<<<<
Prinsip Strategi
Strategi ini menggunakan tiga garis SMA: garis pantas ((14 hari lalai), garis perlahan ((100 hari lalai) dan garis rujukan ((30 hari lalai) <unk>.
Apabila harga penutupan berada di bawah garis rujukan, dan perpindahan rendah garis perlahan berbanding dengan perpindahan rendah yang lebih besar daripada konfigurasi, dan garis cepat naik dan garis perlahan turun, masuk ke dalam multipel. Apabila syarat-syarat ini dipenuhi, garis cepat dan perlahan sangat mungkin bersalin, dan oleh itu merupakan titik permulaan yang baik.
Apabila harga penutupan lebih tinggi daripada garis rujukan, dan perpindahan tinggi garis perlahan lebih besar daripada perpindahan tinggi yang dikonfigurasi, dan harga penutupan telah meningkat secara berturut-turut dengan 3 garis K, telah mencapai keuntungan, dan garis cepat lebih tinggi daripada garis perlahan, kedudukan kosong lebih mudah. Jika harga terus meningkat, penghentian kerugian akan dimulakan.
Setiap dagangan kedudukan yang masuk mengikut nisbah hak dan kepentingan tertentu, dengan cara ini mengawal kedudukan.
Analisis kelebihan strategi
- Menggunakan SMA untuk meluruskan kurva harga dan menapis bunyi pasaran.
- SMA cross mempunyai kemampuan untuk meramalkan trend.
- Tetapan pengalihan berbanding dengan garis SMA, untuk mengelakkan penembusan palsu.
- Menggabungkan trend dan cross-indicator untuk meningkatkan ketepatan keputusan.
- Menggunakan Tracking Stop Loss untuk mengunci keuntungan dan mengelakkan penarikan balik.
Analisis risiko strategi
- SMA sendiri lebih ketinggalan zaman dan mungkin terlepas titik perubahan harga.
- Tetapan bias yang tidak betul boleh menyebabkan terlalu radikal atau terlalu berhati-hati.
- Tetapan parameter tracking stop loss yang tidak betul boleh menyebabkan stop loss terlalu awal atau terlalu besar.
- Tidak mampu menghadapi pasaran yang bergelombang.
Langkah-langkah pengoptimuman:
- Gabungan dengan penyaringan petunjuk terdahulu.
- Pengoptimuman ujian berulang untuk perpindahan.
- Parameter hentian kerugian diuji berulang kali untuk mencari parameter yang optimum.
- Menurunkan kedudukan semasa tahap turun naik.
Arah pengoptimuman strategi
- Uji SMA untuk mencari parameter yang optimum untuk pelbagai kitaran
- Menambah petunjuk lain untuk menilai struktur dan trend pasaran
- Optimumkan parameter tracking stop loss untuk mengunci lebih banyak keuntungan
- Penyesuaian kedudukan mengikut turun naik pasaran
- Ia juga digunakan dalam pelbagai jenis dan dalam kombinasi
ringkaskan
Strategi perdagangan pengalihan pergerakan SMA mencari masa masuk yang terbaik dengan menetapkan pengalihan merujuk kepada rata-rata SMA yang berbeza. Pada masa yang sama, mekanisme keluar ditetapkan untuk mengesan henti kerugian untuk mengunci keuntungan. Strategi ini mudah difahami dan mudah dilaksanakan.
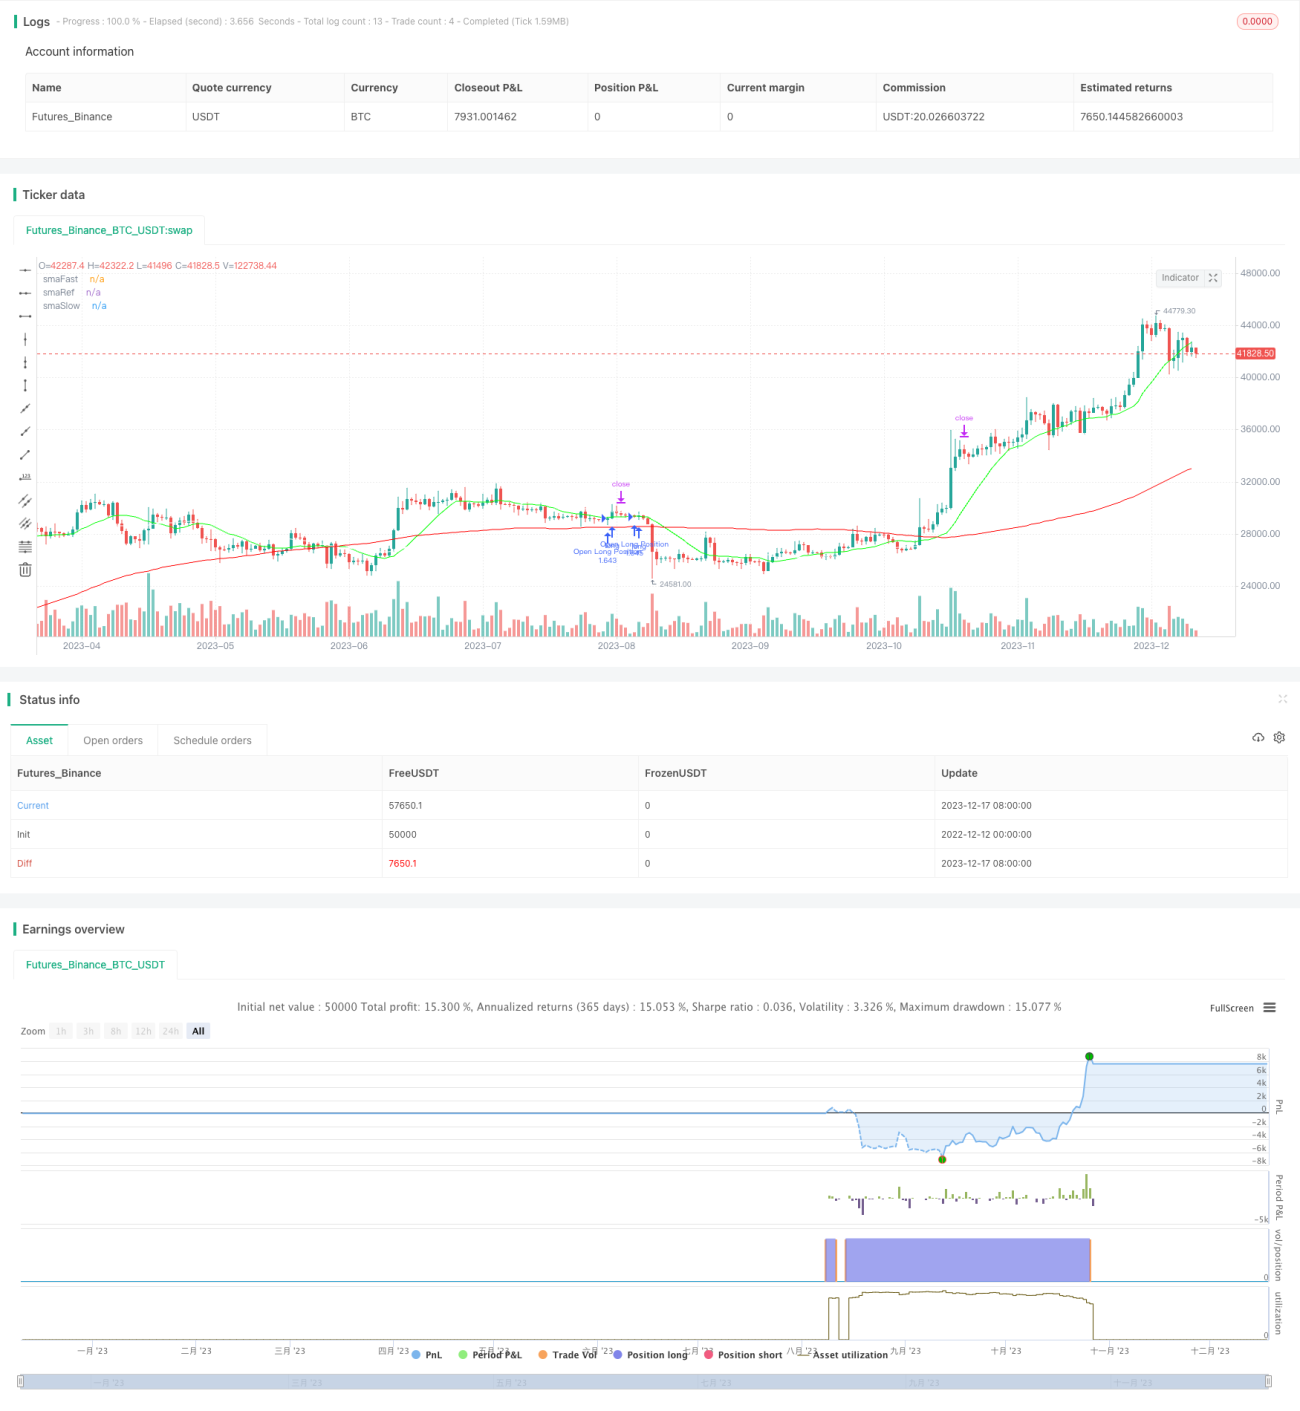
/*backtest
start: 2022-12-12 00:00:00
end: 2023-12-18 00:00:00
period: 1d
basePeriod: 1h
exchanges: [{"eid":"Futures_Binance","currency":"BTC_USDT"}]
*/

// @version=4
// Author: Sonny Parlin (highschool dropout)
strategy(shorttitle="SMA+Strategy", title="SMA Offset Strategy",
overlay=true, currency=currency.USD,- 1