Strategi Penukaran RSI Pantas Noro v1.7
Gambaran keseluruhan
Strategi pertukaran RSI pantas Noro adalah strategi perdagangan kuantitatif yang menggunakan indikator RSI untuk mengenal pasti peluang overbought dan oversold. Strategi ini menggabungkan bentuk K-line, penapisan linear dan kaedah berhenti untuk mengawal risiko.
Strategi ini berdasarkan kepada beberapa komponen utama:
- RSI Rapid: digunakan untuk mengenal pasti peluang overbought dan oversold
- Bentuk garis K: menggabungkan entiti garis K dan garis yin dan yang, membantu menilai trend
- Penapisan rata-rata: penapisan menggunakan rata-rata SMA untuk mengelakkan isyarat palsu
- Mekanisme Hentikan Kerosakan: Menggabungkan kawasan had RSI untuk mencapai Hentikan Kerosakan
Prinsip Strategi
Strategi pertukaran RSI pantas Noro menilai beberapa isyarat beli dan jual berikut:
RSI cepat melangkaui isyarat melangkaui: isyarat perdagangan dihasilkan apabila RSI cepat melangkaui had atas atau bawah had bawahnya.
Isyarat bentuk garis K: menggabungkan saiz entiti garis K, arah garis sinaran, dan lain-lain, untuk menilai trend, membantu menghasilkan isyarat RSI yang cepat.
Isyarat penapisan linear: menggabungkan arah linear SMA untuk mengelakkan pecah palsu.
Sinyal Henti: Hentikan kedudukan apabila RSI cepat kembali melalui had atas atau bawahnya.
Khususnya, strategi ini menilai peluang dagangan berdasarkan rantaian overbought dan oversold pada RSI pantas. Apabila RSI pantas melepasi batas bawahnya, ia dianggap sebagai isyarat oversold; apabila RSI pantas melepasi batas atasnya, ia dianggap sebagai isyarat oversold.
Untuk mengelakkan kebisingan, strategi ini memasukkan penilaian tambahan berikut:
- Saiz entiti K: Semakin besar entiti K, semakin jelas trend
- Garis Siang dan Siang: Menentukan arah trend garis K
- Garis purata SMA: menyaring isyarat penembusan palsu
- Hentikan: Hentikan apabila RSI cepat kembali melalui zon terhad
Oleh itu, strategi ini menggabungkan RSI yang cepat, bentuk garis K, garis purata dan berhenti untuk membuat keputusan perdagangan.
Kelebihan Strategik
Strategi ini mempunyai beberapa kelebihan:
- RSI pantas dan sensitif: peluang untuk membeli dan menjual dengan cepat
- K-Line dan Kesamaan: Elakkan Perdagangan Berbunyi
- Hentikan Kerosakan Otomatik: Hentikan Kerosakan pada Waktu yang Tepat, Kendalikan Risiko
- Sesuai untuk perdagangan garis pendek: Sesuai untuk kitaran garis pendek seperti 1 jam, 30 minit dan sebagainya
- Mudah dioptimumkan: parameter boleh disesuaikan dengan pasaran yang berbeza
Risiko Strategik
Strategi ini juga mempunyai risiko:
- Kemungkinan berlaku hentian berturut-turut: lebih banyak isyarat hentian berlaku dalam keadaan gegaran
- Parameter yang perlu dioptimumkan: Parameter yang perlu disesuaikan untuk kitaran dan varieti yang berbeza
- Tidak dapat mengelakkan kerugian sepenuhnya: Penutupan yang tepat pada masanya juga boleh menyebabkan kerugian
Untuk mengurangkan risiko, anda boleh mengoptimumkan dalam beberapa aspek:
- Mengoptimumkan parameter RSI pantas, mengurangkan perdagangan bising
- Mengoptimumkan kedudukan hentian dan mengawal kerugian tunggal
- Menambah modul pengurusan wang, menyebarkan risiko
Arah pengoptimuman strategi
Strategi ini boleh dioptimumkan dalam beberapa aspek:
- Strategi penarikan tambahan: penarikan selepas keuntungan mencapai tahap tertentu, mengunci sebahagian keuntungan
- Menambah pengurusan wang: penambahan kawalan kedudukan, penyebaran risiko dan lain-lain
- Pengoptimuman parameter yang berbeza: menyesuaikan parameter penunjuk untuk menguji kesan dari pelbagai kitaran
- Menambah pembelajaran mesin: menggunakan algoritma untuk mengoptimumkan parameter secara automatik dan menyesuaikan diri dengan perubahan pasaran
- Ujian pelbagai jenis: Uji kebolehan strategi dalam lebih banyak jenis
Peningkatan lagi strategi ini dengan cara pencegahan, pengurusan risiko, pengoptimuman parameter, pembelajaran mesin dan lain-lain boleh meningkatkan kestabilan strategi.
ringkaskan
Secara keseluruhannya, strategi pertukaran RSI pantas Noro menggabungkan indikator RSI pantas dengan penunjuk teknik K-line yang membantu untuk mewujudkan strategi perdagangan garis pendek untuk menilai overbought dan oversold. Strategi ini bertindak balas dengan cepat dan mudah dioptimumkan, sambil menambah modul stop loss untuk mengawal risiko. Dengan pembelajaran mesin dan pengoptimuman parameter lanjut, diharapkan untuk mendapatkan kesan strategi yang lebih baik.
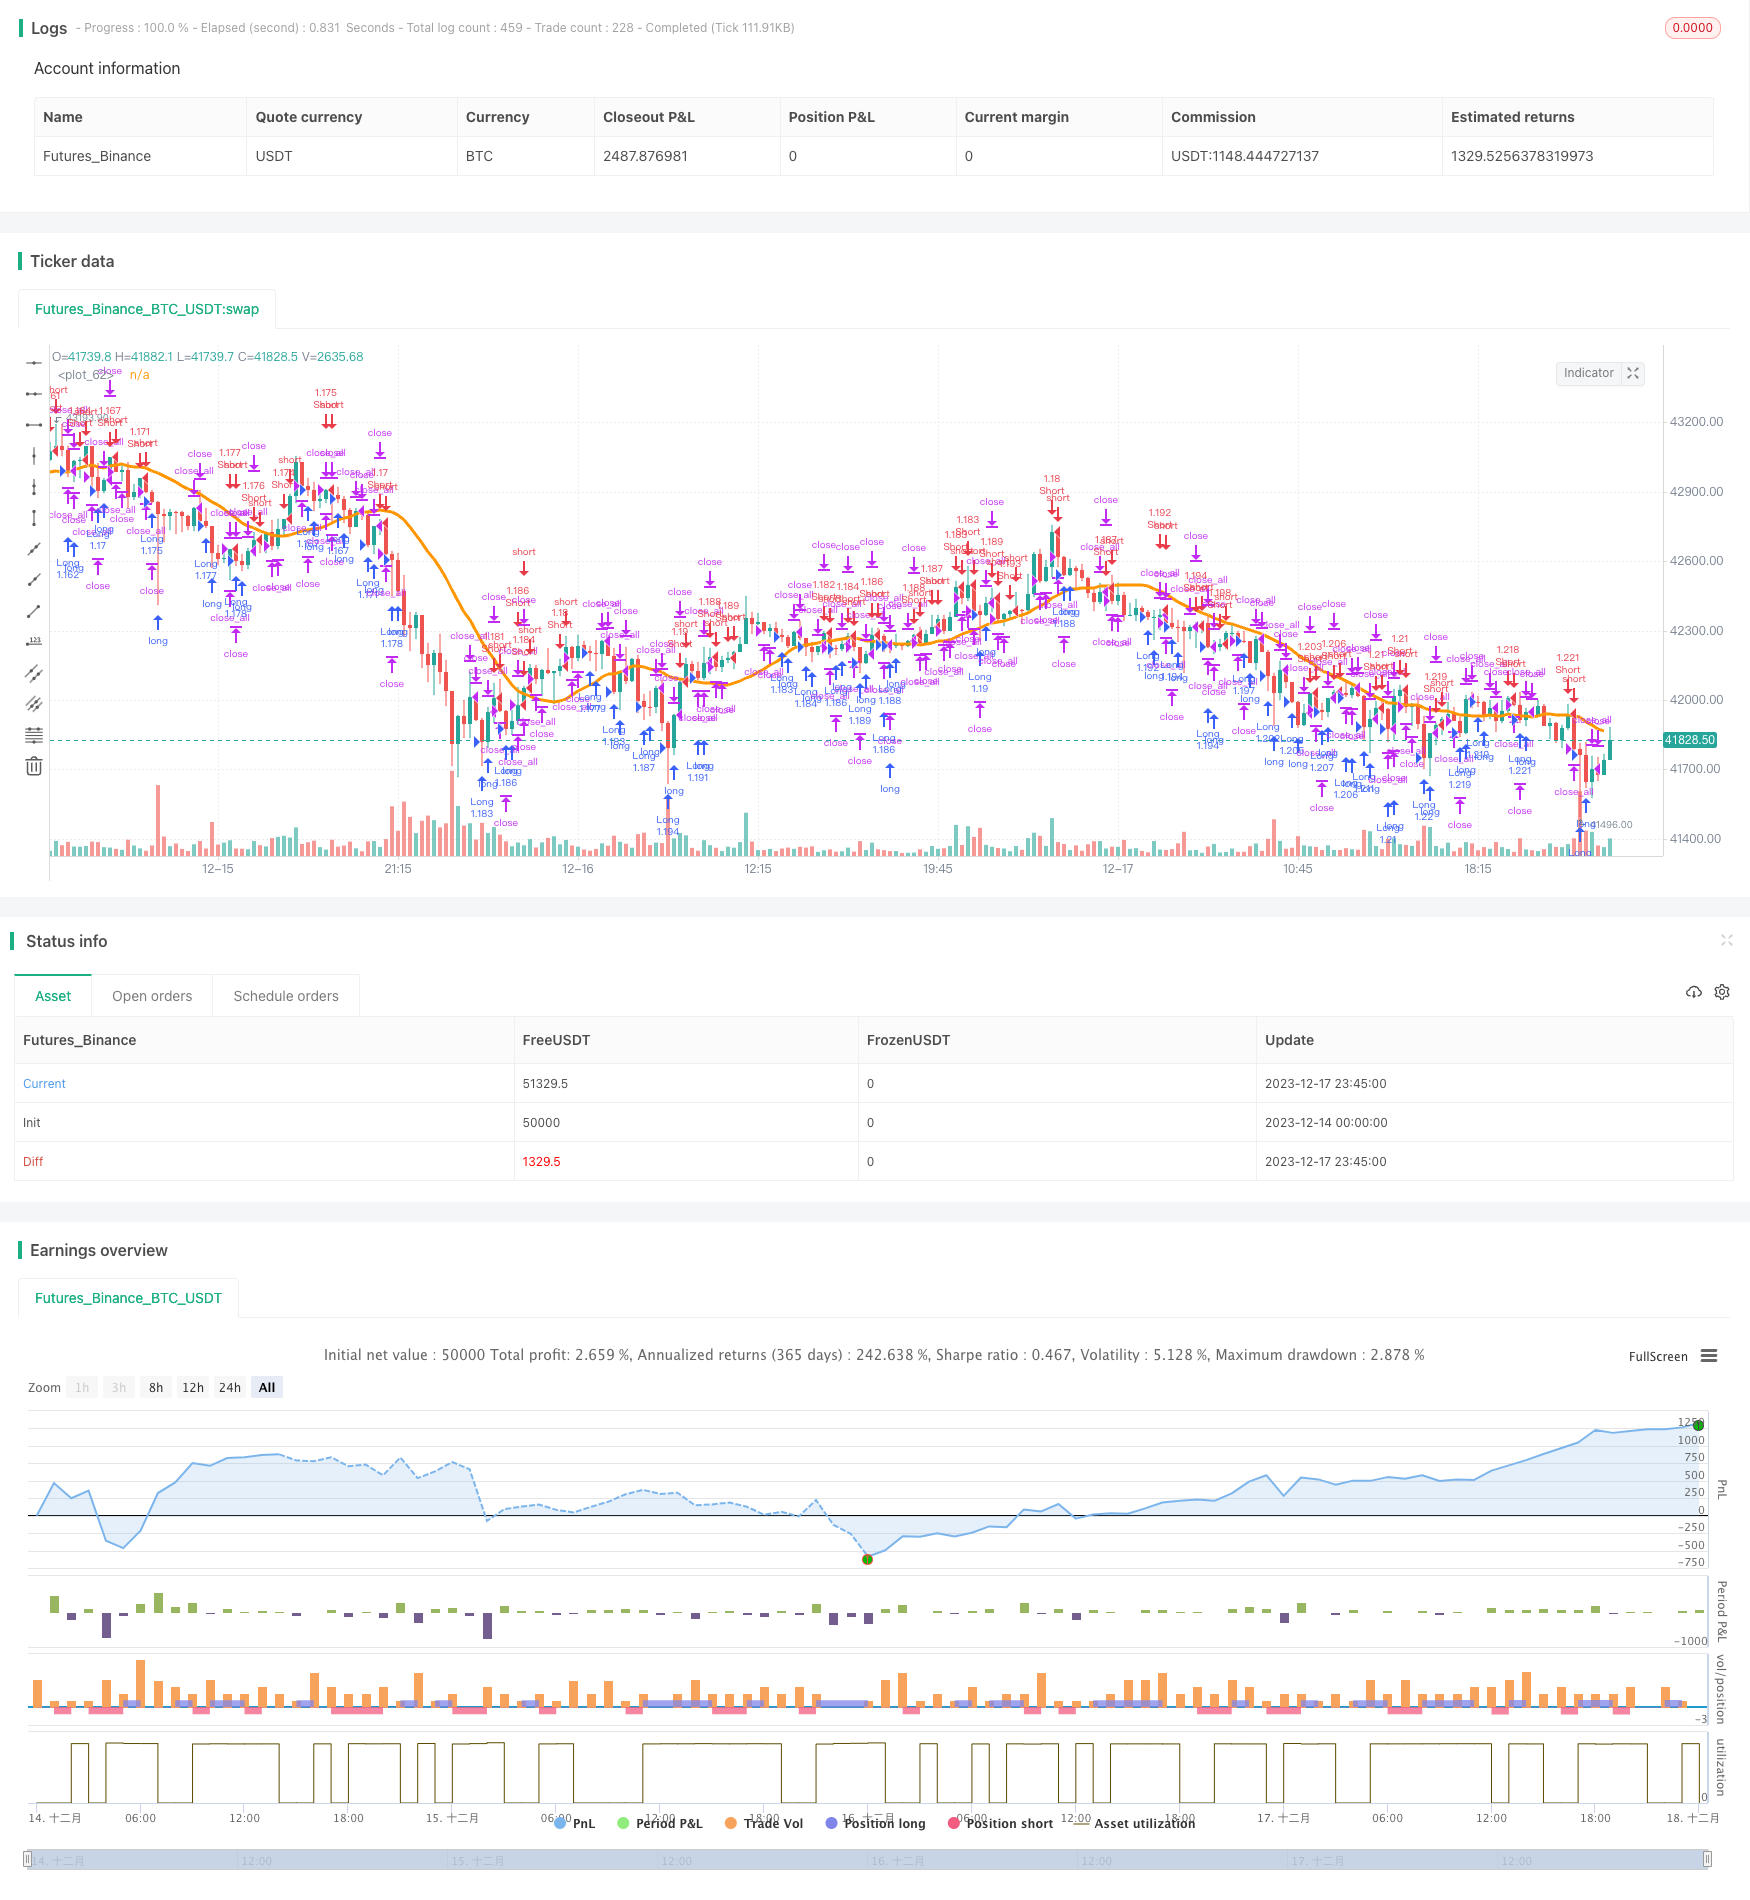
/*backtest
start: 2023-12-14 00:00:00
end: 2023-12-18 00:00:00
period: 15m
basePeriod: 5m
exchanges: [{"eid":"Futures_Binance","currency":"BTC_USDT"}]
*/

//Noro
//2018

//@version=2
strategy(title = "Noro's Fast RSI Strategy v1.7", shorttitle = "Fast RSI str 1.7", overlay = true)

//Settings
needlong = input(true, defval = true, title = "Long")
needshort = input(true, defval = true, title = "Short")
usemar = input(false, defval = false, title = "Use Martingale")
capital = input(100, defval = 100, minval = 1, maxval = 10000, title = "Capital, %")
usersi = input(true, defval = true, title = "Use Fast RSI Strategy")
usemm = input(true, defval = true, title = "Use Min/Max Strategy")
usebc = input(true, defval = true, title = "Use BarColor Strategy")
usesma = input(false, defval = false, title = "Use SMA Filter")
smaperiod = input(20, defval = 20, minval = 2, maxval = 1000, title = "SMA Filter Period")
fast = input(7, defval = 7, minval = 2, maxval = 50, title = "Fast RSI Period")
limit = input(30, defval = 30, minval = 1, maxval = 100, title = "RSI limit")
rsisrc = input(close, defval = close, title = "RSI Price")
rsibars = input(1, defval = 1, minval = 1, maxval = 20, title = "RSI Bars")
mmbars = input(1, defval = 1, minval = 1, maxval = 5, title = "Min/Max Bars")
showsma = input(false, defval = false, title = "Show SMA Filter")
showarr = input(false, defval = false, title = "Show Arrows")
fromyear = input(2018, defval = 2018, minval = 1900, maxval = 2100, title = "From Year")
toyear = input(2100, defval = 2100, minval = 1900, maxval = 2100, title = "To Year")
frommonth = input(01, defval = 01, minval = 01, maxval = 12, title = "From Month")
tomonth = input(12, defval = 12, minval = 01, maxval = 12, title = "To Month")
fromday = input(01, defval = 01, minval = 01, maxval = 31, title = "From day")
today = input(31, defval = 31, minval = 01, maxval = 31, title = "To day")

//Fast RSI
fastup = rma(max(change(rsisrc), 0), fast)
fastdown = rma(-min(change(rsisrc), 0), fast)
fastrsi = fastdown == 0 ? 100 : fastup == 0 ? 0 : 100 - (100 / (1 + fastup / fastdown))

//Limits
bar = close > open ? 1 : close < open ? -1 : 0
uplimit = 100 - limit
dnlimit = limit

//RSI Bars
upsignal = fastrsi > uplimit ? 1 : 0
dnsignal = fastrsi < dnlimit ? 1 : 0
uprsi = sma(upsignal, rsibars) == 1
dnrsi = sma(dnsignal, rsibars) == 1

//Body
body = abs(close - open)
abody = sma(body, 10)

//MinMax Bars
min = min(close, open)
max = max(close, open)
minsignal = min < min[1] and bar == -1 and bar[1] == -1 ? 1 : 0
maxsignal = max > max[1] and bar == 1 and bar[1] == 1 ? 1 : 0
mins = sma(minsignal, mmbars) == 1
maxs = sma(maxsignal, mmbars) == 1

//SMA Filter
sma = sma(close, smaperiod)
colorsma = showsma ? blue : na
plot(sma, color = colorsma, linewidth = 3)

//Signals
up1 = bar == -1 and (strategy.position_size == 0 or close < strategy.position_avg_price) and dnrsi and body > abody / 5 and usersi
dn1 = bar == 1 and (strategy.position_size == 0 or close > strategy.position_avg_price) and uprsi and body > abody / 5 and usersi
up2 = mins and (close > sma or usesma == false) and fastrsi < 70 and usemm
dn2 = maxs and (close < sma or usesma == false) and fastrsi > 30 and usemm
up3 = sma(bar, 2) == -1 and usebc
dn3 = sma(bar, 2) == 1 and usebc
exit = (((strategy.position_size > 0 and fastrsi > dnlimit and bar == 1) or (strategy.position_size < 0 and fastrsi < uplimit and bar == -1)) and body > abody / 2)

//Arrows
col = exit ? black : up1 or dn1 ? blue : up2 or dn2 ? red : na
needup = up1 or up2
needdn = dn1 or dn2
needexitup = exit and strategy.position_size < 0
needexitdn = exit and strategy.position_size > 0
plotarrow(showarr and needup ? 1 : na, colorup = blue, colordown = blue, transp = 0)
plotarrow(showarr and needdn ? -1 : na, colorup = blue, colordown = blue, transp = 0)
plotarrow(showarr and needexitup ? 1 : na, colorup = black, colordown = black, transp = 0)
plotarrow(showarr and needexitdn ? -1 : na, colorup = black, colordown = black, transp = 0)

//Trading
profit = exit ? ((strategy.position_size > 0 and close > strategy.position_avg_price) or (strategy.position_size < 0 and close < strategy.position_avg_price)) ? 1 : -1 : profit[1]
mult = usemar ? exit ? profit == -1 ? mult[1] * 2 : 1 : mult[1] : 1
lot = strategy.position_size == 0 ? strategy.equity / close * capital / 100 * mult : lot[1]

if up1 or up2 or up3
    if strategy.position_size < 0
        strategy.close_all()

    strategy.entry("Long", strategy.long, needlong == false ? 0 : lot)

if dn1 or dn2 or dn3
    if strategy.position_size > 0
        strategy.close_all()

    strategy.entry("Short", strategy.short, needshort == false ? 0 : lot)

if time > timestamp(toyear, tomonth, today, 23, 59) or exit
    strategy.close_all()