Strategi Perdagangan Purata Pergerakan Heinach Berdasarkan Peratusan
Gambaran keseluruhan
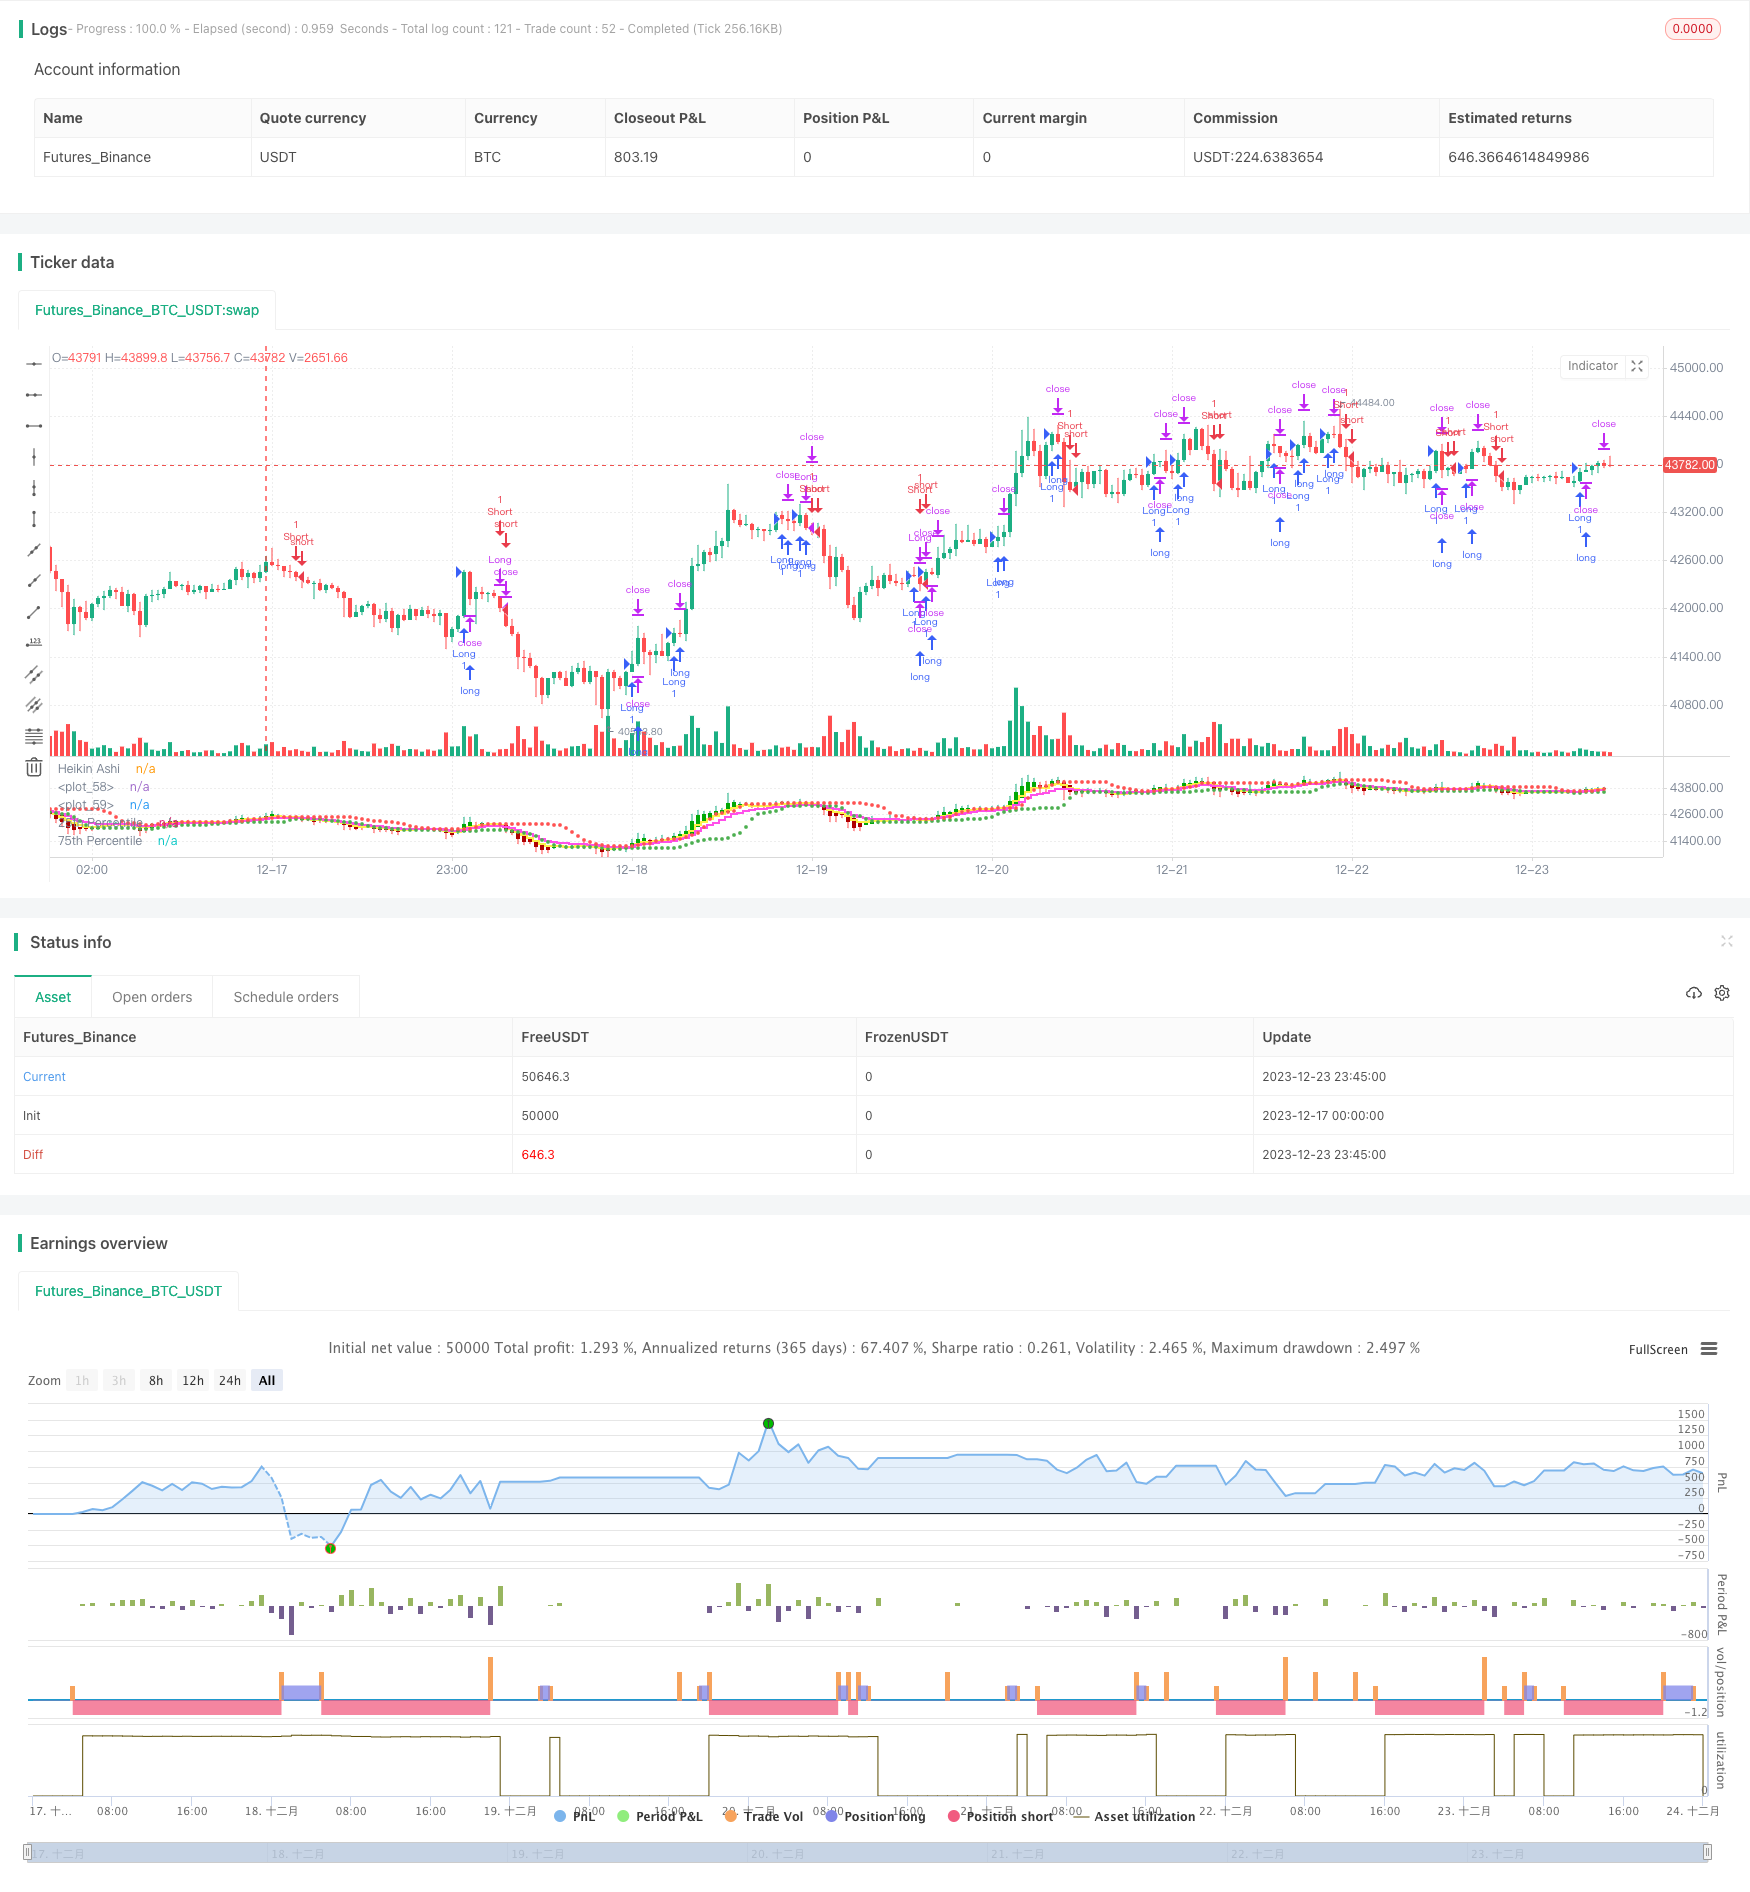
Strategi ini berdasarkan kepada penjanaan isyarat perdagangan pada garis rata-rata Heinrich. Di antaranya, penjanaan isyarat beli dan jual mengambil kira dua faktor iaitu persilangan harga penutupan Heinrich dengan tahap harga 75 peratus dan harga penutupan Heinrich yang lebih tinggi daripada purata bergerak.
Prinsip Strategi
Strategi ini menggunakan garis Hine Ashe untuk analisis dan bukannya garis K biasa, yang menyaring kebisingan pasaran dan lebih baik untuk mencari trend dan isyarat pembalikan. Secara khusus, strategi ini menggabungkan saluran peratusan dan purata bergerak untuk menghasilkan isyarat perdagangan:
- Ia menghasilkan isyarat beli apabila harga Hyndai mencecah 75 peratus harga penutupan.
- Sinyal jual muncul apabila Heinrich Hines menembusi purata bergerak 5 hari di bawah harga penutupan.
Selain itu, strategi ini juga menetapkan jarak hentian dan pengesanan hentian untuk mengawal risiko unilateral.
Kelebihan Strategik
- Garis rata-rata Heinrich digunakan untuk mengenal pasti trend dengan lebih jelas dan untuk mengesan isyarat pembalikan pada masa yang tepat.
- Dengan menggunakan saluran peratusan, ia dapat menentukan sama ada harga berada dalam keadaan terlampau panas atau terlampau terjual, untuk menentukan masa pembelian dan penjualan.
- Menetapkan hentian dan menjejaki hentian membantu mengawal risiko secara aktif dan mengelakkan kerugian melebihi yang dapat ditanggung.
Risiko Strategik
- Garis purata Heinrich sendiri akan menyebabkan kelewatan dan mungkin terlepas titik terbaik untuk operasi garis pendek.
- Saluran peratusan tidak dapat menentukan titik peralihan harga sepenuhnya, terdapat beberapa kadar isyarat palsu.
- Jarak hentian yang tidak betul mungkin terlalu longgar atau terlalu ketat, dan seterusnya mempengaruhi prestasi strategi.
Untuk mengurangkan risiko di atas, anda boleh menyesuaikan kitaran purata bergerak atau menyesuaikan peratusan hentian, dan sebagainya.
Pengoptimuman Strategi
- Uji gabungan purata bergerak yang berbeza untuk mencari parameter terbaik.
- Uji parameter saluran peratusan yang berlainan untuk memastikan harga di kawasan panas ditangkap.
- Meneroka isyarat beli dan jual, dan menyaring isyarat palsu.
- Secara dinamik menyesuaikan jarak henti.
ringkaskan
Strategi ini mengintegrasikan beberapa petunjuk seperti garis Heinrich, saluran peratusan dan purata bergerak untuk membentuk sistem perdagangan. Sistem ini dapat mengenal pasti arah trend dengan berkesan dan menetapkan stop loss untuk mengawal risiko. Strategi perdagangan kuantitatif yang patut dipertimbangkan.
/*backtest
start: 2023-12-17 00:00:00
end: 2023-12-24 00:00:00
period: 45m
basePeriod: 5m
exchanges: [{"eid":"Futures_Binance","currency":"BTC_USDT"}]
*/

//@version=5
strategy("HK Percentile Interpolation One",shorttitle = "HKPIO", overlay=false, default_qty_type = strategy.cash, default_qty_value = 5000, calc_on_order_fills = true, calc_on_every_tick = true)

// Input parameters
stopLossPercentage = input(3, title="Stop Loss (%)") // User can set Stop Loss as a percentage
trailStopPercentage = input(1.5, title="Trailing Stop (%)") // User can set Trailing Stop as a percentage
lookback = input.int(14, title="Lookback Period", minval=1) // User can set the lookback period for percentile calculation
yellowLine_length = input.int(5, "Yellow", minval=1) // User can set the length for Yellow EMA
purplLine_length = input.int(10, "Purple", minval=1) // User can set the length for Purple EMA
holdPeriod = input.int(200, title="Minimum Holding Period", minval=10) // User can set the minimum holding period
startDate = timestamp("2021 01 01")  // User can set the start date for the strategy

// Calculate Heikin Ashi values
haClose = ohlc4
var float haOpen = na
haOpen := na(haOpen[1]) ? (open + close) / 2 : (haOpen[1] + haClose[1]) / 2
haHigh = math.max(nz(haOpen, high), nz(haClose, high), high)
haLow = math.min(nz(haOpen, low), nz(haClose, low), low)

// Calculate Moving Averages
yellowLine = ta.ema(haClose, yellowLine_length)
purplLine = ta.ema(haClose, purplLine_length)

// Calculate 25th and 75th percentiles
p25 = ta.percentile_linear_interpolation(haClose, lookback, 28)
p75 = ta.percentile_linear_interpolation(haClose, lookback, 78)

// Generate buy/sell signals
longSignal = ta.crossover(haClose, p75) and haClose > yellowLine
sellSignal = ta.crossunder(haClose, yellowLine)
longSignal1 = ta.crossover(haClose, p75) and haClose > purplLine
sellSignal1 = ta.crossunder(haClose, purplLine)

// Set start time and trade conditions
if(time >= startDate)
    // When longSignal is true, enter a long trade and set stop loss and trailing stop conditions
    if (longSignal)
        strategy.entry("Long", strategy.long, 1)
        strategy.exit("Sell", "Long", stop=close*(1-stopLossPercentage/100), trail_points=close*trailStopPercentage/100, trail_offset=close*trailStopPercentage/100)
    // When sellSignal is true, close the long trade
    if (sellSignal)
        strategy.close("Long")
    // When sellSignal1 is true, enter a short trade
    if (sellSignal1)
        strategy.entry("Short", strategy.short, 1)
    // When longSignal1 is true, close the short trade
    if (longSignal1)
        strategy.close("Short")

// Plot Heikin Ashi candles
plotcandle(haOpen, haHigh, haLow, haClose, title="Heikin Ashi", color=(haClose >= haOpen ? color.rgb(1, 168, 6) : color.rgb(176, 0, 0)))

// Plot 25th and 75th percentile levels
plot(p25, title="25th Percentile", color=color.green, linewidth=1, style=plot.style_circles)
plot(p75, title="75th Percentile", color=color.red, linewidth=1, style=plot.style_circles)

// Plot Moving Averages
plot(yellowLine, color = color.rgb(254, 242, 73, 2), linewidth = 2, style = plot.style_stepline)
plot(purplLine, color = color.rgb(255, 77, 234, 2), linewidth = 2, style = plot.style_stepline)