Strategi mengikut arah aliran berdasarkan RSI dan purata bergerak wajaran
Gambaran keseluruhan
Strategi ini didasarkan pada dua indikator terkenal: indikator relatif lemah ((RSI) dan purata bergerak bertimbangan ((Weighted Moving Average, WMA), yang digunakan untuk mengenal pasti trend pasaran dan menjejaki arahnya. RSI digunakan untuk menentukan overbought dan oversold, dan WMA digunakan untuk menentukan trend harga, yang digabungkan untuk menyaring dengan berkesan isyarat yang tidak berkaitan dan meningkatkan kebarangkalian keuntungan.
Prinsip Strategi
Indeks RSI
RSI adalah salah satu penunjuk overbought dan oversold yang paling terkenal.
\[RSI = 100 - \frac{100}{1+\frac{AvgGain}{AvgLoss}}\]
AvgGain ialah jumlah hari harga penutupan melebihi harga pembukaan dalam tempoh tertentu, dan AvgLoss ialah jumlah hari harga penutupan melebihi harga pembukaan. AvgGain ialah jumlah hari harga penutupan melebihi harga pembukaan, dan AvgLoss ialah jumlah hari harga penutupan melebihi harga pembukaan.
Strategi ini menetapkan kitaran RSI menjadi 20, sebagai penunjuk untuk menilai trend. Apabila RSI lebih besar daripada 60, ia menghasilkan isyarat multihead, dan apabila ia kurang daripada 40, ia menghasilkan isyarat kosong.
Purata bergerak bertimbangan WMA
WMA lebih kuat daripada SMA untuk membetulkan harga terkini. Formula pengiraan adalah:
\[WMA = \frac{\sum_{i=1}^n w_i x_i}{\sum_{i=1}^n w_i}\]
w adalah berat, dengan peningkatan i, w meningkat secara indeks. Formula berat yang digunakan dalam strategi ini adalah:
\[w = \begin{cases} 100/(4+(n-4)*1.3), & i <= 3 \ 1.3*w, & i > 3 \end{cases}\]
Iaitu, 3 hari terakhir mempunyai berat yang sama, dan setiap hari selepas itu, beratnya meningkat sebanyak 1.3 kali ganda.
Dalam strategi ini, tempoh WMA adalah 20 hari.
Isyarat strategi
Isyarat berbilang kepala: RSI > 60 dan WMA 20 hari ROC < -1
isyarat kosong: RSI < 40 dan WMA 20 hari ROC > 1
Formula untuk mengira 20 hari ROC WMA ialah:
\[ROC = (WMA_{hari ini}/WMA_{20 hari yang lalu} - 1) \times 100\]
Kelebihan Strategik
- Menggunakan RSI untuk menentukan arah trend dan mengelakkan kehabisan wang dalam pasaran yang bergolak
- WMA menilai trend utama dalam mengurangkan bunyi bising dengan menambah berat baru-baru ini
- RSI dan WMA ROC digunakan bersama-sama untuk menapis isyarat yang tidak berkaitan dengan berkesan
- Menggunakan pelbagai ATR Random Stop, Tracking Stop memberikan fleksibiliti untuk mengunci keuntungan
- Kaedah pengurusan wang boleh menyesuaikan saiz kedudukan mengikut keadaan kerugian dan kawalan risiko
Risiko Strategik
- Parameter strategi yang tidak betul boleh menyebabkan perdagangan yang kerap, parameter yang disyorkan untuk dioptimumkan
- Penetapan titik henti yang tidak betul boleh meningkatkan kerugian
- Sebagai strategi trend-following, tidak sesuai untuk pasaran pengurutan yang bergolak.
- Perhatian kepada perubahan persekitaran makro, dan penyesuaian manual jika perlu
Arah pengoptimuman strategi
- Uji panjang RSI, panjang WMA, dan nilai ROC untuk mencari kombinasi parameter yang optimum
- Uji kaedah pengurusan wang yang berbeza untuk mencari penyelesaian terbaik
- Menambah pengukuran lain untuk menapis lebih jauh
- Menurunkan risiko kerugian tunggal dengan strategi berhenti kerugian
- Mengoptimumkan strategi penangguhan untuk meningkatkan keuntungan semasa trend
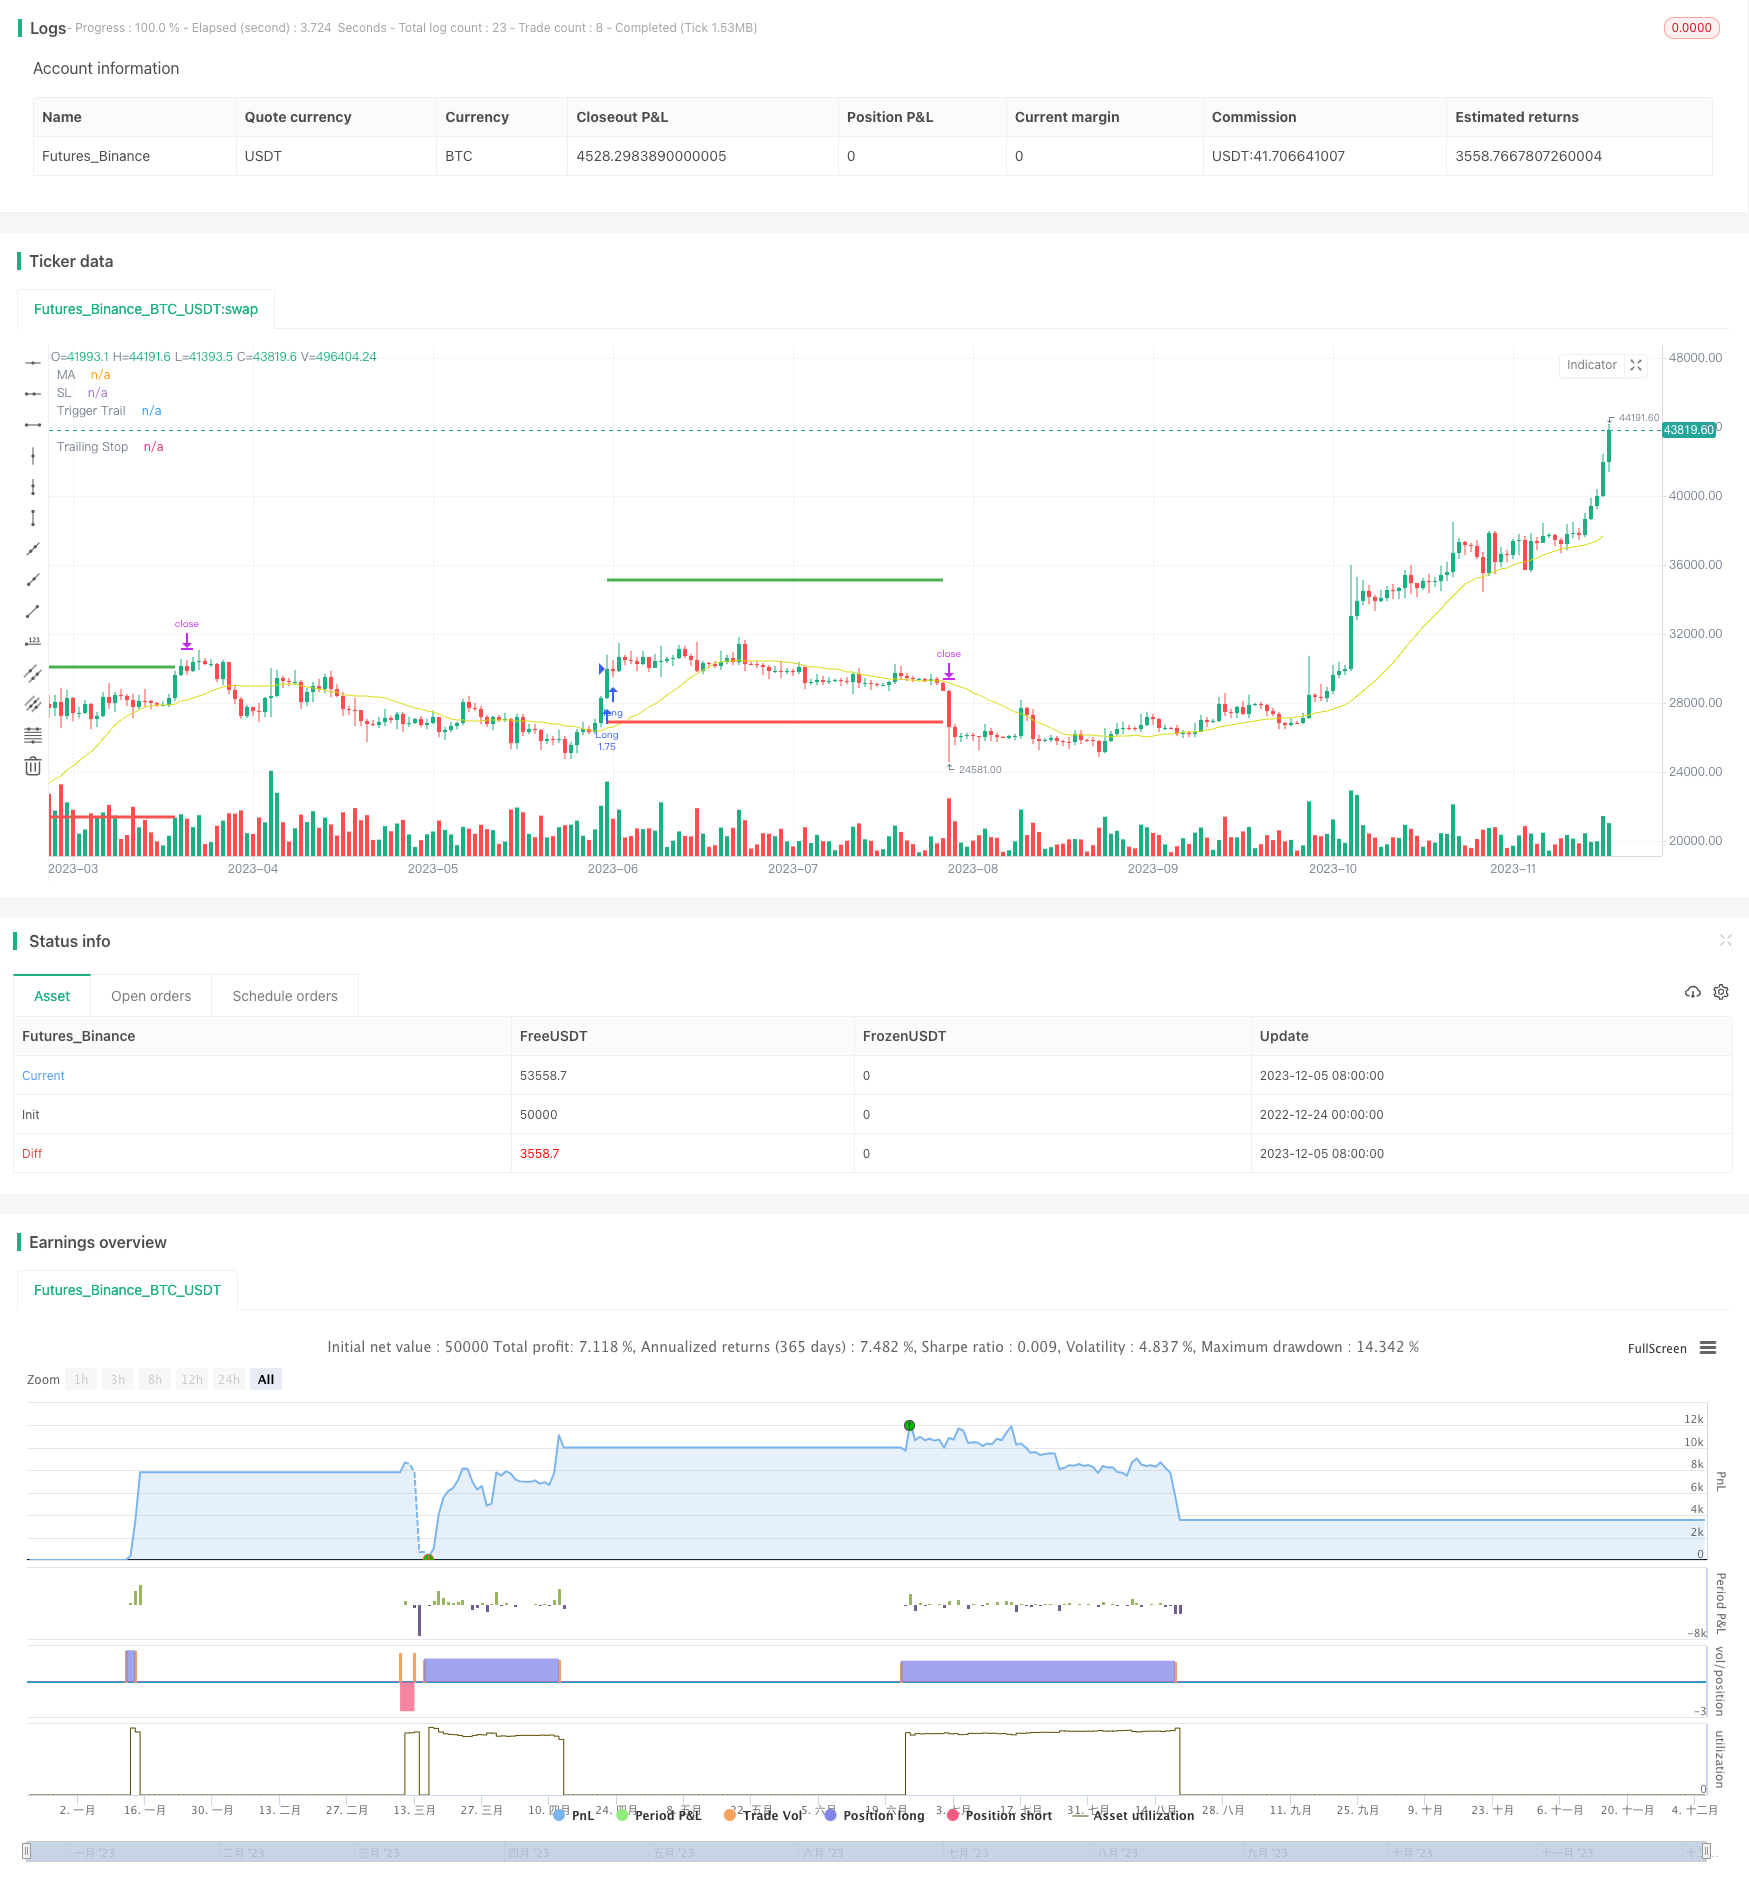
ringkaskan
Strategi ini menggunakan RSI dan WMA untuk menentukan arah trend, untuk mengambil keuntungan dari trend utama. Ia mempunyai nilai sebenar dalam peperangan dengan menggunakan pengurusan wang dan strategi kawalan risiko. Tetapi pengaturan parameter dan mekanisme penghentian kerugian perlu terus diuji dan dioptimumkan untuk mendapatkan kesan yang lebih baik.
/*backtest
start: 2022-12-24 00:00:00
end: 2023-12-06 05:20:00
period: 1d
basePeriod: 1h
exchanges: [{"eid":"Futures_Binance","currency":"BTC_USDT"}]
*/

// This source code is subject to the terms of the Mozilla Public License 2.0 at https://mozilla.org/MPL/2.0/
// © gsanson66


//This code is based on RSI and a backed weighted MA
//@version=5
strategy("RSI + MA BACKTESTING", overlay=true, initial_capital=1000, default_qty_type=strategy.fixed, commission_type=strategy.commission.percent, commission_value=0.18, slippage=3)


//------------------------TOOL TIPS---------------------------//

t1 = "Choice between a Standard MA (SMA) or a backed-weighted MA (RWMA) which permits to minimize the impact of short term reversal. Default is RWMA."
t2 = "Value of RSI to send a LONG or a SHORT signal. RSI above 60 is a LONG signal and RSI below 40 is a SHORT signal."
t3 = "Rate of Change Value of selected MA to send a LONG or a SHORT signal. By default : ROC MA below -1 is a LONG signal and ROC MA above 1 is a SHORT signal"
t4 = "Threshold value to trigger trailing Take Profit. This threshold is calculated as a multiple of the ATR (Average True Range)."
t5 = "Percentage value of trailing Take Profit. This Trailing TP follows the profit if it increases, remaining selected percentage below it, but stops if the profit decreases."
t6 = "Each gain or losse (relative to the previous reference) in an amount equal to this fixed ratio will change quantity of orders."
t7 = "The amount of money to be added to or subtracted from orders once the fixed ratio has been reached."


//------------------------FUNCTIONS---------------------------//

//@function which calculate a retro weighted moving average to minimize the impact of short term reversal
rwma(source, length) =>
    sum = 0.0
    denominator = 0.0
    weight = 0.0
    weight_x = 100/(4+(length-4)*1.30)
    weight_y = 1.30*weight_x
    for i=0 to length - 1
        if i <= 3
            weight := weight_x
        else
            weight := weight_y
        sum := sum + source[i] * weight
        denominator := denominator + weight
    rwma = sum/denominator

//@function which permits the user to choose a moving average type
ma(source, length, type) =>
    switch type
        "SMA" => ta.sma(source, length)
        "RWMA" => rwma(source, length)

//@function Displays text passed to `txt` when called.
debugLabel(txt, color) =>
    label.new(bar_index, high, text = txt, color=color, style = label.style_label_lower_right, textcolor = color.black, size = size.small)

//@function which looks if the close date of the current bar falls inside the date range
inBacktestPeriod(start, end) => (time >= start) and (time <= end)


//--------------------------------USER INPUTS-------------------------------//

//Technical parameters
rsiLengthInput = input.int(20, minval=1, title="RSI Length", group="RSI Settings")
maTypeInput = input.string("RWMA", title="MA Type", options=["SMA", "RWMA"], group="MA Settings", inline="1", tooltip=t1)
maLenghtInput = input.int(20, minval=1, title="MA Length", group="MA Settings", inline="1")
rsiLongSignalValue = input.int(60, minval=1, maxval=99, title="RSI Long Signal", group="Strategy parameters", inline="3")
rsiShortSignalValue = input.int(40, minval=1, maxval=99, title="RSI Short Signal", group="Strategy parameters", inline="3", tooltip=t2)
rocMovAverLongSignalValue = input.float(-1, maxval=0, title="ROC MA Long Signal", group="Strategy parameters", inline="4")
rocMovAverShortSignalValue = input.float(1, minval=0, title="ROC MA Short Signal", group="Strategy parameters", inline="4", tooltip=t3)
//TP Activation and Trailing TP
takeProfitActivationInput = input.float(5, minval=1.0, title="TP activation in multiple of ATR", group="Strategy parameters", tooltip=t4)
trailingStopInput = input.float(3, minval=0, title="Trailing TP in percentage", group="Strategy parameters", tooltip=t5)
//Money Management
fixedRatio = input.int(defval=400, minval=1, title="Fixed Ratio Value ($)", group="Money Management", tooltip=t6)
increasingOrderAmount = input.int(defval=200, minval=1, title="Increasing Order Amount ($)", group="Money Management", tooltip=t7)
//Backtesting period
startDate = input(title="Start Date", defval=timestamp("1 Jan 2018 00:00:00"), group="Backtesting Period")
endDate = input(title="End Date", defval=timestamp("1 July 2024 00:00:00"), group="Backtesting Period")


//------------------------------VARIABLES INITIALISATION-----------------------------//

float rsi = ta.rsi(close, rsiLengthInput)
float ma = ma(close, maLenghtInput, maTypeInput)
float roc_ma = ((ma/ma[maLenghtInput]) - 1)*100
float atr = ta.atr(20)
var float trailingStopOffset = na
var float trailingStopActivation = na
var float trailingStop = na
var float stopLoss = na
var bool long = na
var bool short = na
var bool bufferTrailingStopDrawing = na
float theoreticalStopPrice = na
bool inRange = na
equity = math.abs(strategy.equity - strategy.openprofit)
strategy.initial_capital = 50000
var float capital_ref = strategy.initial_capital
var float cashOrder = strategy.initial_capital * 0.95


//------------------------------CHECKING SOME CONDITIONS ON EACH SCRIPT EXECUTION-------------------------------//

//Checking if the date belong to the range
inRange := true

//Checking performances of the strategy
if equity > capital_ref + fixedRatio
    spread = (equity - capital_ref)/fixedRatio
    nb_level = int(spread)
    increasingOrder = nb_level * increasingOrderAmount
    cashOrder := cashOrder + increasingOrder
    capital_ref := capital_ref + nb_level*fixedRatio
if equity < capital_ref - fixedRatio
    spread = (capital_ref - equity)/fixedRatio
    nb_level = int(spread)
    decreasingOrder = nb_level * increasingOrderAmount
    cashOrder := cashOrder - decreasingOrder
    capital_ref := capital_ref - nb_level*fixedRatio

//Checking if we close all trades in case where we exit the backtesting period
if strategy.position_size!=0 and not inRange
    debugLabel("END OF BACKTESTING PERIOD : we close the trade", color=color.rgb(116, 116, 116))
    strategy.close_all()
    bufferTrailingStopDrawing := false
    stopLoss := na
    trailingStopActivation := na
    trailingStop := na
    short := false
    long := false


//------------------------------STOP LOSS AND TRAILING STOP ACTIVATION----------------------------//

// We handle the stop loss and trailing stop activation
if (low <= stopLoss or high >= trailingStopActivation) and long
    if high >= trailingStopActivation
        bufferTrailingStopDrawing := true
    else if low <= stopLoss
        long := false
    stopLoss := na
    trailingStopActivation := na
if (low <= trailingStopActivation or high >= stopLoss) and short
    if low <= trailingStopActivation
        bufferTrailingStopDrawing := true
    else if high >= stopLoss
        short := false
    stopLoss := na
    trailingStopActivation := na


//-------------------------------------TRAILING STOP--------------------------------------//

// If the traling stop is activated, we manage its plotting with the bufferTrailingStopDrawing
if bufferTrailingStopDrawing and long
    theoreticalStopPrice := high - trailingStopOffset * syminfo.mintick
    if na(trailingStop)
        trailingStop := theoreticalStopPrice
    else if theoreticalStopPrice > trailingStop
        trailingStop := theoreticalStopPrice
    else if low <= trailingStop
        trailingStop := na
        bufferTrailingStopDrawing := false
        long := false
if bufferTrailingStopDrawing and short
    theoreticalStopPrice := low + trailingStopOffset * syminfo.mintick
    if na(trailingStop)
        trailingStop := theoreticalStopPrice
    else if theoreticalStopPrice < trailingStop
        trailingStop := theoreticalStopPrice
    else if high >= trailingStop
        trailingStop := na
        bufferTrailingStopDrawing := false
        short := false


//---------------------------------LONG CONDITION--------------------------//

if rsi >= 60 and roc_ma <= rocMovAverLongSignalValue and inRange and not long
    if short
        bufferTrailingStopDrawing := false
        stopLoss := na
        trailingStopActivation := na
        trailingStop := na
        short := false
    trailingStopActivation := close + takeProfitActivationInput*atr
    trailingStopOffset := (trailingStopActivation * trailingStopInput/100) / syminfo.mintick
    stopLoss := close - 3*atr
    long := true
    qty = cashOrder/close
    strategy.entry("Long", strategy.long, qty)
    strategy.exit("Exit Long", "Long", stop = stopLoss, trail_price = trailingStopActivation,
                 trail_offset = trailingStopOffset)


//--------------------------------SHORT CONDITION-------------------------------//

if rsi <= 40 and roc_ma >= rocMovAverShortSignalValue and inRange and not short
    if long
        bufferTrailingStopDrawing := false
        stopLoss := na
        trailingStopActivation := na
        trailingStop := na
        long := false
    trailingStopActivation := close - takeProfitActivationInput*atr
    trailingStopOffset := (trailingStopActivation * trailingStopInput/100) / syminfo.mintick
    stopLoss := close + 3*atr
    short := true
    qty = cashOrder/close
    strategy.entry("Short", strategy.short, qty)
    strategy.exit("Exit Short", "Short", stop = stopLoss, trail_price = trailingStopActivation,
                 trail_offset = trailingStopOffset)


//--------------------------------PLOTTING ELEMENT---------------------------------//

// Plotting of element in the graph
plotchar(rsi, "RSI", "", location.top, color.rgb(0, 214, 243))
plot(ma, "MA", color.rgb(219, 219, 18))
plotchar(roc_ma, "ROC MA", "", location.top, color=color.orange)
// Visualizer trailing stop and stop loss movement
plot(stopLoss, "SL", color.red, 3, plot.style_linebr)
plot(trailingStopActivation, "Trigger Trail", color.green, 3, plot.style_linebr)
plot(trailingStop, "Trailing Stop",  color.blue, 3, plot.style_linebr)