Strategi aliran kuantitatif JBravo
Gambaran Keseluruhan Strategi
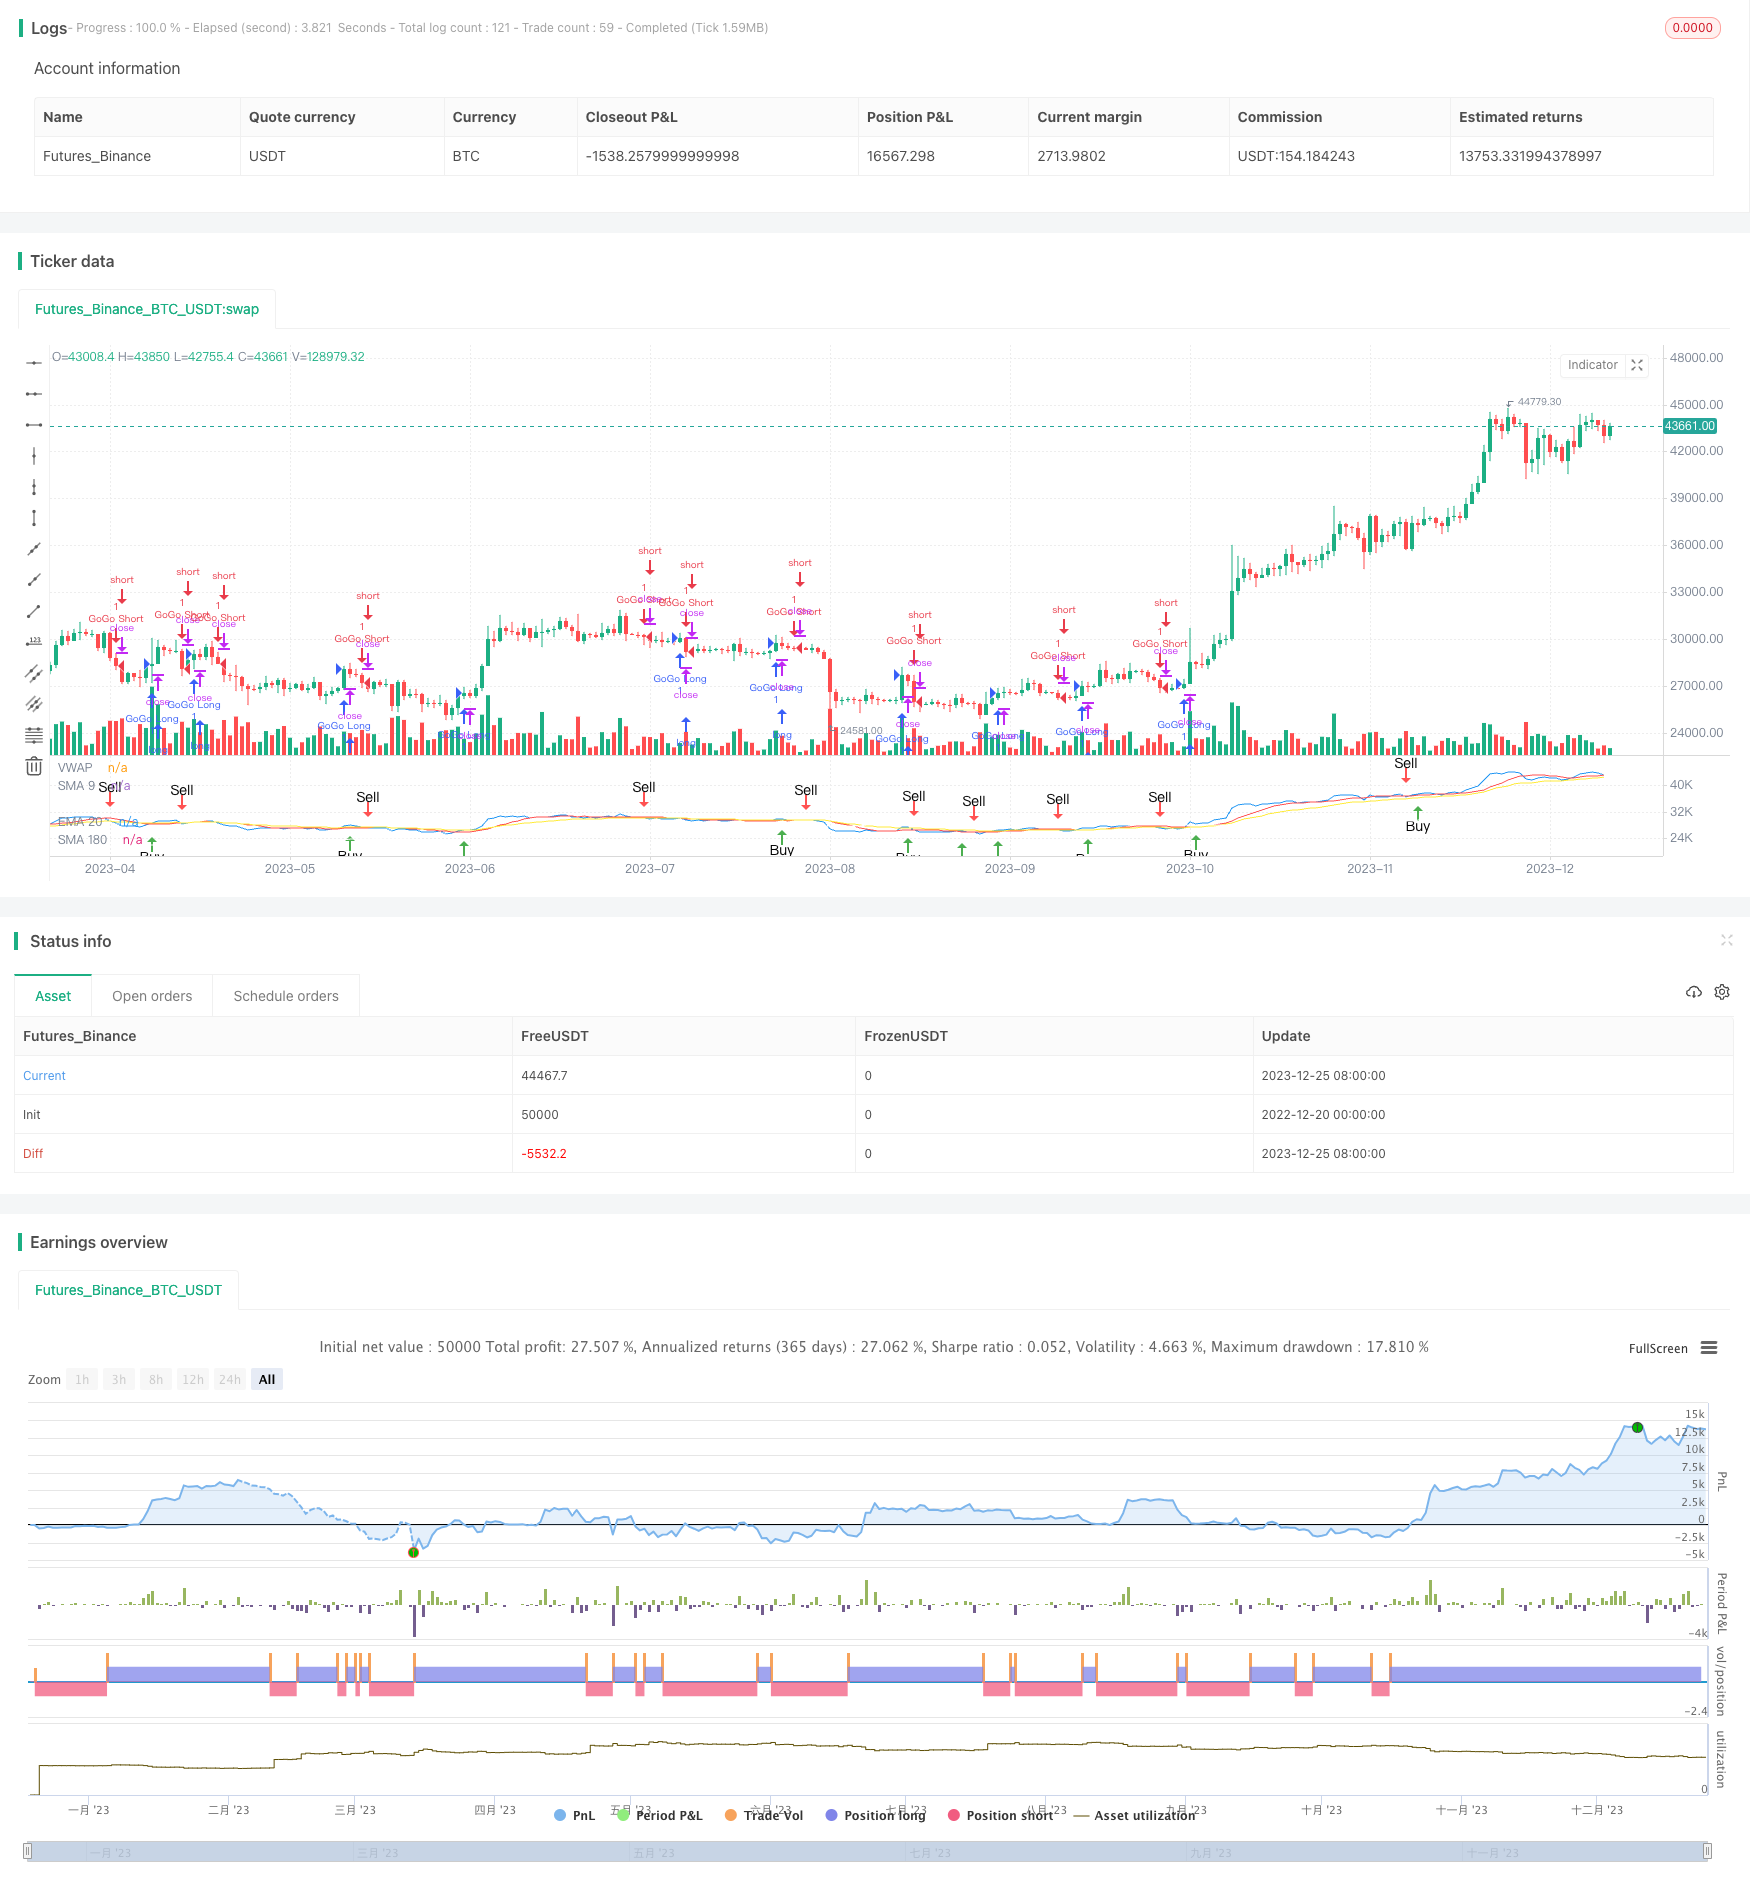
Strategi trend kuantitatif JBravo adalah strategi pengesanan trend berdasarkan purata bergerak. Ia menggunakan purata bergerak sederhana 9 hari, purata bergerak indeks 20 hari, dan purata bergerak sederhana 180 hari untuk menilai arah trend pasaran, dan akhirnya membeli dan menjual isyarat.
Nama strategi ini diilhamkan daripada watak animasi Johnny Bravo, yang mewakili keputusan perdagangan yang yakin dan tegas. Perkataan “GoGo Juice” menggambarkan terjunnya VWAP apabila ia melintasi purata bergerak indeks 20 hari.
Prinsip Strategi
Apabila satu K-line menutup harga melalui purata bergerak mudah 9 hari, ia menghasilkan isyarat beli; apabila ia menutup harga melalui purata bergerak indeks 20 hari, ia menghasilkan isyarat jual.
Jika purata bergerak 9, 20 dan 180 hari semuanya ke atas, dan purata bergerak 9 hari lebih tinggi daripada purata bergerak 20 hari, purata bergerak 20 hari lebih tinggi daripada purata bergerak 180 hari, maka ia menghasilkan isyarat beli yang kuat.
Jika purata bergerak 9, 20 dan 180 hari semuanya ke bawah, dan purata bergerak 9 hari lebih rendah daripada purata bergerak 20 hari, purata bergerak 20 hari lebih rendah daripada purata bergerak 180 hari, maka ia akan menghasilkan isyarat menjual yang kuat.
Apabila garis harga rata-rata bertimbangan dagangan melintasi rata-rata pergerakan indeks 20 hari dari arah bawah, ia akan menghasilkan isyarat go-go yang lebih rendah; apabila garis harga rata-rata bertimbangan dagangan melintasi rata-rata pergerakan indeks 20 hari dari arah atas, ia akan menghasilkan isyarat go-go yang lebih rendah.
Analisis kelebihan strategi
Strategi ini menggabungkan pemikiran strategi trend dan penembusan. Rata-rata bergerak dapat menentukan arah trend pasaran dengan jelas, mengurangkan kebarangkalian perdagangan yang salah. Pada masa yang sama, ia menggunakan harga purata yang tertimbang dengan jumlah transaksi yang fleksibel untuk menentukan masa masuk, dan mengawal risiko sambil berharap pasaran akan pecah.
Berbanding dengan menggunakan rata-rata bergerak sahaja, strategi ini menambah mekanisme masuk tergesa-gesa dalam GoGo jus, yang boleh menghasilkan kadar ganjaran pasaran yang lebih tinggi dalam keadaan yang kuat.
Secara keseluruhannya, penarikan balik dari strategi ini adalah kecil dan mempunyai keuntungan yang stabil.
Analisis risiko strategi
Walaupun strategi ini menambah mekanisme kemasukan yang kuat, titik-titik berhenti mungkin sering dipicu dalam keadaan yang bergolak. Selain itu, rata-rata bergerak itu sendiri sangat laggy dan tidak dapat menangkap perubahan harga dalam masa yang tepat.
Ini bermakna bahawa strategi ini mungkin menghasilkan sejumlah perdagangan maya yang tidak dapat mencerminkan harga pasaran. Selain itu, masuk yang kuat juga meningkatkan risiko kerugian.
Untuk mengurangkan risiko, anda boleh menyesuaikan kitaran rata-rata bergerak dengan sewajarnya; atau menambah modul hentikan kerugian, hentikan kerugian dan keluar setelah kerugian mencapai tahap tertentu.
Arah pengoptimuman strategi
Strategi ini boleh dioptimumkan dalam beberapa arah:
Sesuaikan parameter purata bergerak, optimumkan parameter kitaran, dan cari kombinasi parameter terbaik
Meningkatkan pengukuran kuantiti transaksi untuk mengelakkan isyarat yang salah semasa turun naik harga.
Tambah modul hentian kerugian, atur peraturan keluar padang, mengawal kerugian tunggal
Menggabungkan pilihan sektor pasaran panas untuk menjadikan strategi lebih disasarkan
Optimumkan peratusan kedudukan terbuka, optimumkan skala kedudukan yang berbeza dengan parameter yang berbeza
ringkaskan
Strategi trend kuantitatif JBravo mengintegrasikan analisis purata bergerak dan penilaian trend harga purata bertimbangan jumlah transaksi. Ia mengejar keuntungan panjang yang stabil, dengan mekanisme perdagangan yang agak agresif.
||
Strategy Overview
The JBravo Quantitative Trend Strategy is a trend-following strategy based on moving averages. It uses the 9-day simple moving average, 20-day exponential moving average, and 180-day simple moving average to determine the market trend direction, as well as the final buy and sell signals.
The strategy name is inspired by the cartoon character Johnny Bravo, representing a confident and decisive trading decision. The term “GoGo Juice” depicts the aggressive entry when the VWAP line crosses the 20-day exponential moving average.
Strategy Principle
A buy signal is generated when the closing price crosses above the 9-day simple moving average; A sell signal is generated when the closing price crosses below the 20-day exponential moving average.
If the 9-day, 20-day and 180-day moving averages are all moving up, and the 9-day moving average is above the 20-day moving average, the 20-day moving average is above the 180-day moving average, a strong buy signal is generated.
If the 9-day, 20-day and 180-day moving averages are all moving down, and the 9-day moving average is below the 20-day moving average, the 20-day moving average is below the 180-day moving average, a strong sell signal is generated.
When the Volume Weighted Average Price line crosses the 20-day exponential moving average upward, a “GoGo Long” signal is generated; When the Volume Weighted Average Price line crosses the 20-day exponential moving average downward, a “GoGo Short” signal is generated.
Advantage Analysis
This strategy combines the ideas of trend following and breakout strategies. Moving averages can clearly determine the direction of the market trend and reduce the probability of wrong trades. At the same time, it flexibly uses the VWAP indicator to determine the entry time, controlling risks while favoring breakthroughs in the market.
Compared to using moving averages alone, this strategy adds the aggressive entry mechanism of “GoGo Juice”, which can obtain higher returns in strong trends.
Overall, this strategy has small drawdowns and stable profitability.
Risk Analysis
Although the strategy increases the strength of entries, stop loss points can be frequently triggered in sideways markets. In addition, moving averages themselves have high inertia and cannot keep up with price changes in time.
This means that the strategy may generate a certain number of virtual trades that do not actually reflect market price movements. In addition, aggressive entries also increase the risk of losses.
To reduce risks, we can adjust the cycle of moving averages as appropriate; or add a stop loss module to stop loss when losses reach a certain level.
Optimization Directions
The strategy can be optimized in the following directions:
Adjust moving average parameters and optimize cycle parameters to find the optimal parameter combination
Add volume indicators to avoid false signals in times of violent price fluctuations
Increase stop loss modules and set exit rules to control per trade loss
Combine selections of market hot sectors to make strategies more targeted
Optimize opening position proportions, optimize different scale for different parameters
Conclusion
The JBravo Quantitative Trend Strategy integrates moving average analysis and VWAP trend judgment. It pursues stable long-term profits while having a certain degree of aggressive trading mechanisms. The strategy is suitable for medium-long term holdings, with medium-high risks and high returns. It can become a part of portfolio trading strategies with very good market adaptability.
[/trans]
/*backtest
start: 2022-12-20 00:00:00
end: 2023-12-26 00:00:00
period: 1d
basePeriod: 1h
exchanges: [{"eid":"Futures_Binance","currency":"BTC_USDT"}]
*/

// This source code is subject to the terms of the Mozilla Public License 2.0 at https://mozilla.org/MPL/2.0/
// © bradvaughn

//@version=4
strategy("JBravo Swing", overlay = false)

var buy_in_progress = false


//Moving Averages
smaInput1 = input(title="Display SMA 9", type=input.bool, defval=true)
smaInput2 = input(title="Display EMA 20", type=input.bool, defval=true)
smaInput4 = input(title="Display SMA 180", type=input.bool, defval=true)
colored_180 = input(false, title="Color-code 180 trend direction")
vwapInput = input(title="Display VWAP", type=input.bool, defval=true)

sma9 = sma(close, 9)
ema20 = ema(close, 20)
sma180 = sma(close, 180)

//Plot Moving Averages
plot(smaInput1 ? sma9 : na, color= color.red, title="SMA 9")
plot(smaInput2 ? ema20 : na, color = color.yellow, title="EMA 20")

// Plot VWAP
vwap1 = vwap(hlc3)
plot(vwapInput ? vwap1 : na, color = color.blue, title="VWAP")
vwaplong = vwap1 > ema20
vwapshort = vwap1 < ema20

//Color SMA 180 trend direction if selected
sma180_uptrend = sma(close, 180) > sma(close[2], 180)
colr = sma180_uptrend == true or colored_180 == false ? color.white : colored_180 == true ? color.gray : na
plot(smaInput4 ? sma180 : na, color = colr, title="SMA 180")

//Get value of lower end of candle
buyLow = iff(lowest(open, 1) < lowest(close, 1), lowest(open, 1), lowest(close, 1))
sellLow = lowest(close, 1)

// Find the lower MA for crossover sell condition
sellma = iff((sma9<ema20), sma9, ema20)


//SMA 9 trend direction
sma9_uptrend = sma(close, 9) > sma(close[2], 9)
//EMA 20 trend direction
ema20_uptrend = ema(close, 20) > sma(close[2], 20)

//Buy or sell if conditions are met
// Buy when the candle low is above the SMA9
// Sell when the candle low is below the lower of SMA9 and EMA20
Buy = iff(buy_in_progress == false and buyLow > sma9 == true, true, false)
Sell = iff(buy_in_progress == true and sellLow < sellma == true, true, false)

// Determine stong buy and strong sell conditions.
// If moving averages are all up, then this will qualify a buy as a strong buy.
// If the moving averages are not up (ie. down) then this will qualify a sell as a strong sell
StrongBuy = iff (Buy and sma9_uptrend and sma180_uptrend and ema20_uptrend and (sma9 > ema20) and (ema20 > sma180), true, false)
StrongSell = iff (Sell and not sma9_uptrend and not sma180_uptrend and not ema20_uptrend and (sma9 < ema20) and (ema20 < sma180), true, false)

//Update Trading status if bought or sold
if Buy
    buy_in_progress := true
if Sell
    buy_in_progress := false

// Clear Buy and Sell conditions if StrongBuy or StrongSell conditions exist.
// This disables plotting Buy and Sell conditions
if StrongBuy
    Buy := false
if StrongSell
    Sell := false


//Display BUY/SELL indicators

plotshape(Buy,title="Buy", color=color.green, style=shape.arrowup,location=location.belowbar, text="Buy")
plotshape(StrongBuy,title="Strong Buy", color=color.green, style=shape.arrowup,location=location.belowbar, text="Strong Buy")
plotshape(Sell,title="Sell", color=color.red, style=shape.arrowdown,text="Sell")
plotshape(StrongSell,title="Strong Sell", color=color.red, style=shape.arrowdown,text="Strong Sell")

strategy.entry("GoGo Long", strategy.long, 1, when=vwaplong and vwapInput)
strategy.entry("GoGo Short", strategy.short, 1, when=vwapshort and vwapInput)

strategy.close("GoGo Long", when = vwapshort and vwapInput)
strategy.close("GoGo Short", when = vwaplong and vwapInput)


alertcondition(Buy, title="Buy Signal", message="Buy")
alertcondition(Sell, title="Sell Signal", message="Sell")