Strategi mengikut arah aliran berdasarkan pengayun terlicin
Gambaran keseluruhan
Strategi ini berasaskan kepada indikator pergerakan yang lancar untuk mengenal pasti trend harga dan menggunakan kaedah trend-tracking untuk berdagang. Apabila harga melanggar garis petunjuk, lakukan overhead, dan apabila harga jatuh dari garis petunjuk, lakukan short head.
Prinsip Strategi
Strategi ini menggunakan penunjuk goyang rata yang disesuaikan untuk mengenal pasti trend harga. Penunjuk itu mengira harga putaran balik pada garis K semasa, iaitu harga teoretis yang dapat membalikkan kerugian dan warna grafik trajektori. Kemudian, harga putaran balik itu diproses secara halus, dan menghasilkan garis penunjuk goyang rata akhir.
Strategi menggunakan garis penunjuk yang pecah sebagai isyarat untuk meletakkan kedudukan. Berbuat lebih banyak apabila harga melanggar garis penunjuk dan kosong apabila harga jatuh ke bawah garis penunjuk.
Kelebihan Strategik
- Menggunakan penunjuk tersuai untuk mengenal pasti trend, prestasi yang lebih baik
- Menggunakan trend-tracking, hampir sama dengan teori perdagangan trend kuantitatif
- Tetapan Hentikan Kerosakan Menyokong Kawalan Risiko
Analisis risiko
- Indeks mempunyai tahap kemerosotan yang boleh menyebabkan strategi tidak berfungsi dengan baik
- Menerusi satu indikator sahaja, ia mudah memberi isyarat yang salah.
- Tetapan henti rugi ada ruang untuk pengoptimuman, mungkin berlaku fenomena henti rugi berlebihan
Arah pengoptimuman
- Pertimbangkan untuk memfilter isyarat dagangan dengan penunjuk lain, seperti Bollinger Bands, RSI dan lain-lain.
- Uji tetapan parameter penunjuk yang berbeza
- Ujian dan pengoptimuman mod penangguhan
- Lebih banyak data untuk pelbagai jenis dan kitaran ujian
ringkaskan
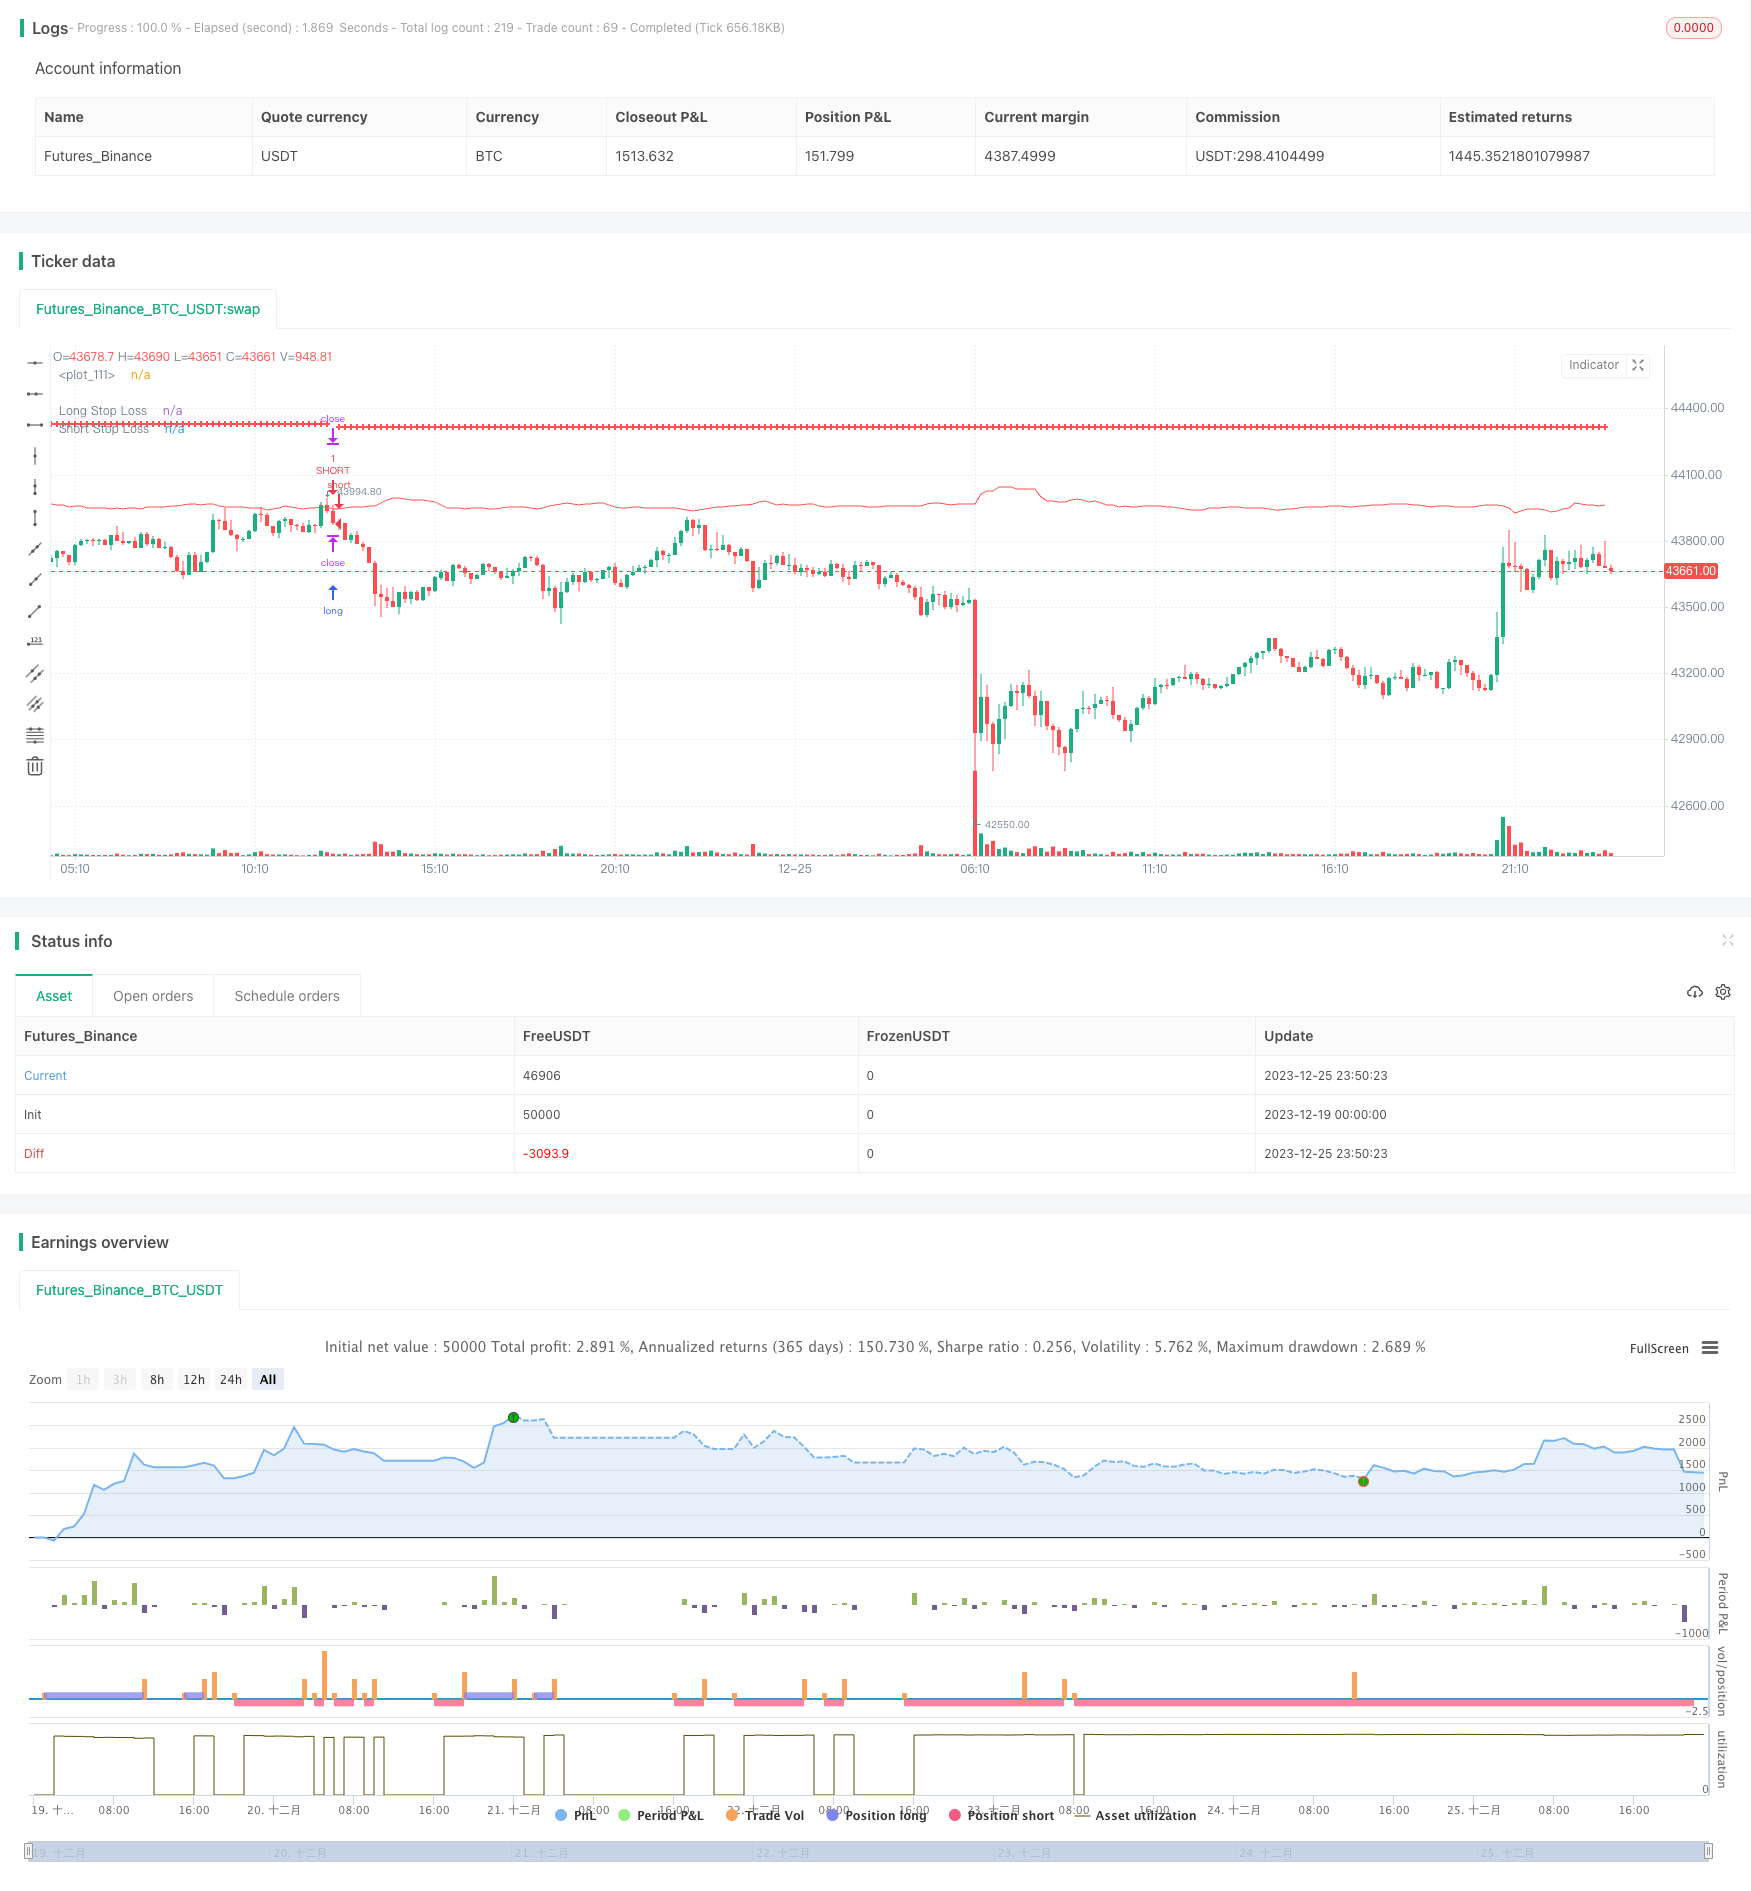
Strategi ini mempunyai pemikiran keseluruhan yang jelas, menggunakan indikator tersuai untuk mengenal pasti trend dan berdagang dengan cara mengikuti trend. Dari hasil pengkajian semula, strategi ini berkinerja baik dan mempunyai potensi untuk digunakan di pasaran. Tetapi hanya bergantung pada satu indikator dan terdapat pengulangan tertentu, kualiti isyarat masih belum disahkan.
/*backtest
start: 2023-12-19 00:00:00
end: 2023-12-26 00:00:00
period: 10m
basePeriod: 1m
exchanges: [{"eid":"Futures_Binance","currency":"BTC_USDT"}]
*/

// This source code is subject to the terms of the Mozilla Public License 2.0 at https://mozilla.org/MPL/2.0/

// © TraderHalai
// This is a backtest of the Smoothed Heikin Ashi Trend indicator, which computes the reverse candle close price required to flip a heikin ashi trend from red to green and vice versa. Original indicator can be found on the scripts section of my profile.

// Default testing parameters are 10% of equity position size, with a 1% stop loss on short and long strategy.opentrades.commission

// This particular back test uses this indicator as a Trend trading tool with a tight stop loss. The equity curve as tested seems promising but requires further work to refine. Note in an actual trading setup, you may wish to use this with volatilty filters as most of the losses are in sideways, low volatility markets.


//@version=5
strategy("Smoothed Heikin Ashi Trend on Chart - TraderHalai BACKTEST", " SHA Trend - BACKTEST", overlay=true)
//Inputs

i_useSmooth =       input ( true, "Use smoothing Heikin Ashi")
i_smoothingMethod = input.string("SMA", "Method", options=["SMA", "EMA", "HMA", "VWMA", "RMA"])
i_smoothingPeriod = input ( 10, "Smoothing period")

i_infoBox   =       input ( true, "Show Info Box"        )
i_decimalP  =       input ( 2,    "Prices Decimal Places")
i_boxOffSet =       input ( 5,    "Info Box Offset"      )
i_repaint   =       input (false,  "Repaint -  Keep on for live / Off for backtest")

i_longLossPerc = input.float(title="Long Stop Loss (%)",minval=0.0, step=0.1, defval=1) * 0.01

i_shortLossPerc = input.float(title="Short Stop Loss (%)", minval=0.0, step=0.1, defval=1) * 0.01


timeperiod = timeframe.period

//Security functions to avoid repaint, as per PineCoders
f_secureSecurity(_symbol, _res, _src) => request.security(_symbol, _res, _src[1], lookahead = barmerge.lookahead_on)
f_security(_symbol, _res, _src, _repaint) => request.security(_symbol, _res, _src[_repaint ? 0 : barstate.isrealtime ? 1 : 0])[_repaint ? 0 : barstate.isrealtime ? 0 : 1]
f_secSecurity2(_symbol, _res, _src) => request.security(_symbol, _res, _src[1])


candleClose = f_security(syminfo.tickerid, timeperiod, close, i_repaint)
candleOpen = f_security(syminfo.tickerid, timeperiod, open, i_repaint)
candleLow = f_security(syminfo.tickerid, timeperiod, low, i_repaint)
candleHigh = f_security(syminfo.tickerid, timeperiod, high, i_repaint)

haTicker = ticker.heikinashi(syminfo.tickerid)
haClose = f_security(haTicker, timeperiod, close, i_repaint)
haOpen = f_security(haTicker, timeperiod, open, i_repaint)
haLow = f_security(haTicker, timeperiod, low, i_repaint)
haHigh= f_security(haTicker, timeperiod, high, i_repaint)


reverseClose = (2 * (haOpen[1] + haClose[1])) - candleHigh - candleLow - candleOpen

if(reverseClose < candleLow)
    reverseClose := (candleLow + reverseClose) / 2

if(reverseClose > candleHigh)
    reverseClose := (candleHigh + reverseClose) / 2

//Smoothing

smaSmoothed = ta.sma(reverseClose, i_smoothingPeriod)
emaSmoothed = ta.ema(reverseClose, i_smoothingPeriod)
hmaSmoothed = ta.hma(reverseClose, i_smoothingPeriod)
vwmaSmoothed = ta.vwma(reverseClose, i_smoothingPeriod)
rmaSmoothed = ta.rma(reverseClose, i_smoothingPeriod)

shouldApplySmoothing = i_useSmooth and i_smoothingPeriod > 1

smoothedReverseClose = reverseClose

if(shouldApplySmoothing)
    if(i_smoothingMethod == "SMA")
        smoothedReverseClose := smaSmoothed
    else if(i_smoothingMethod == "EMA")
        smoothedReverseClose := emaSmoothed
    else if(i_smoothingMethod == "HMA")
        smoothedReverseClose := hmaSmoothed
    else if(i_smoothingMethod == "VWMA")
        smoothedReverseClose := vwmaSmoothed
    else if(i_smoothingMethod == "RMA")
        smoothedReverseClose := rmaSmoothed
    else
        smoothedReverseClose := reverseClose // Default to non-smoothed for invalid smoothing type

haBull = candleClose >= smoothedReverseClose
haCol = haBull ? color.green : color.red


//Overall trading strategy
if(ta.crossover(candleClose, smoothedReverseClose))
    strategy.entry("LONG", strategy.long, stop=smoothedReverseClose)
else
    strategy.cancel("LONG")

if(ta.crossunder(candleClose, smoothedReverseClose))
    strategy.entry("SHORT", strategy.short, stop=smoothedReverseClose)
else
    strategy.cancel("SHORT")


longStopPrice  = strategy.position_avg_price * (1 - i_longLossPerc)
shortStopPrice = strategy.position_avg_price * (1 + i_shortLossPerc)


plot(series=(strategy.position_size > 0) ? longStopPrice : na,
     color=color.red, style=plot.style_cross,
     linewidth=2, title="Long Stop Loss")
plot(series=(strategy.position_size < 0) ? shortStopPrice : na,
     color=color.red, style=plot.style_cross,
     linewidth=2, title="Short Stop Loss")

plot(smoothedReverseClose, color=haCol)

if (strategy.position_size > 0)
    strategy.exit(id="XL STP", stop=longStopPrice)

if (strategy.position_size < 0)
    strategy.exit(id="XS STP", stop=shortStopPrice)