Strategi mengikut arah aliran berdasarkan pelbagai petunjuk
Gambaran keseluruhan
Strategi ini dinamakanStrategi untuk mengesan trend dalam gabungan pelbagai indikator(Multi-Indicator Trend Tracking Strategy), yang menggunakan indikator Fisher yang berubah, rata-rata bergerak bertimbangan ((WMA), indikator yang agak kuat ((RSI) dan garis rata-rata ((OBV) untuk menentukan arah trend pasaran, untuk melakukan perdagangan mengikut trend.
Prinsip Strategi
- Indeks perubahan Fisher menilai trend dan kekuatan perubahan harga. Ia memberi isyarat perdagangan apabila 4 garis Fisher berubah warna pada masa yang sama.
- WMA menilai arah trend utama. RSI menapis isyarat palsu.
- Indeks OBV digunakan untuk mengesahkan trend.
Khususnya, penunjuk perubahan Fisher terdiri daripada 1 kali ganda, 2 kali ganda, 4 kali ganda dan 8 kali ganda 4 baris. Apabila 4 baris menghasilkan isyarat banyak apabila mereka bertukar hijau ke atas, dan 4 baris menghasilkan isyarat kosong apabila mereka bertukar merah ke bawah.
Analisis kelebihan
Strategi ini mempunyai kelebihan berikut:
- Indeks perubahan Fisher mempunyai kefahaman yang kuat, apabila 4 garis Fisher berubah warna pada masa yang sama, ia memastikan bahawa terdapat kemungkinan besar untuk pembalikan trend.
- WMA menilai arah trend utama dan mengelakkan dagangan berlawanan arah.
- Penunjuk OBV mengesahkan trend, mengelakkan terobosan palsu di pasaran tanpa trend.
- RSI menapis isyarat palsu untuk memastikan kebolehpercayaan isyarat.
Penggunaan gabungan pelbagai petunjuk, yang memastikan ketepatan dan kebolehpercayaan isyarat perdagangan, serta keupayaan untuk mengesan trend, dapat memberikan kesan strategi yang lebih baik.
Analisis risiko
Strategi ini juga mempunyai risiko:
- Jika pasaran bertolak ansur, garis Fisher mudah menghasilkan isyarat palsu. Dalam kes ini, penapis RSI diperlukan.
- Pengaturan parameter WMA yang tidak betul juga boleh menjejaskan penghakiman accurancy.
- Indeks penukaran Fisher lebih buruk dalam menilai keadaan pada garis ultra pendek.
- Jika ia berlaku, strategi ini boleh menyebabkan kerugian besar.
Untuk mengurangkan risiko, parameter RSI boleh disesuaikan dengan sewajarnya, optimum parameter kitaran WMA. Pada masa yang sama, titik berhenti boleh ditetapkan untuk mengelakkan kerugian yang terlalu besar.
Arah pengoptimuman
Strategi ini boleh dioptimumkan dengan cara:
- Anda boleh menguji keberkesanan strategi dengan parameter kitaran yang berbeza untuk mencari kombinasi parameter terbaik.
- Menambah mekanisme hentian kerugian. Hentikan kerugian apabila kerugian mencapai peratusan tertentu.
- Dengan penyesuaian lebih lanjut parameter untuk penunjuk penukaran Fisher berdasarkan hasil pengukuran semula, kombinasi parameter yang paling tepat untuk menentukan penunjuk telah dijumpai.
- Cuba tambahkan penapisan untuk indikator lain, seperti indeks kekuatan, indeks kelemahan, dan sebagainya.
- Uji pelbagai tetapan saiz kedudukan terbuka.
ringkaskan
Strategi ini menggunakan indikator perubahan Fisher, indikator WMA, indikator OBV dan indikator RSI untuk menilai arah trend pasaran. Ia menilai isyarat dengan tepat, mempunyai keupayaan pengesahan yang kuat, dan dapat mengunci trend dengan berkesan.
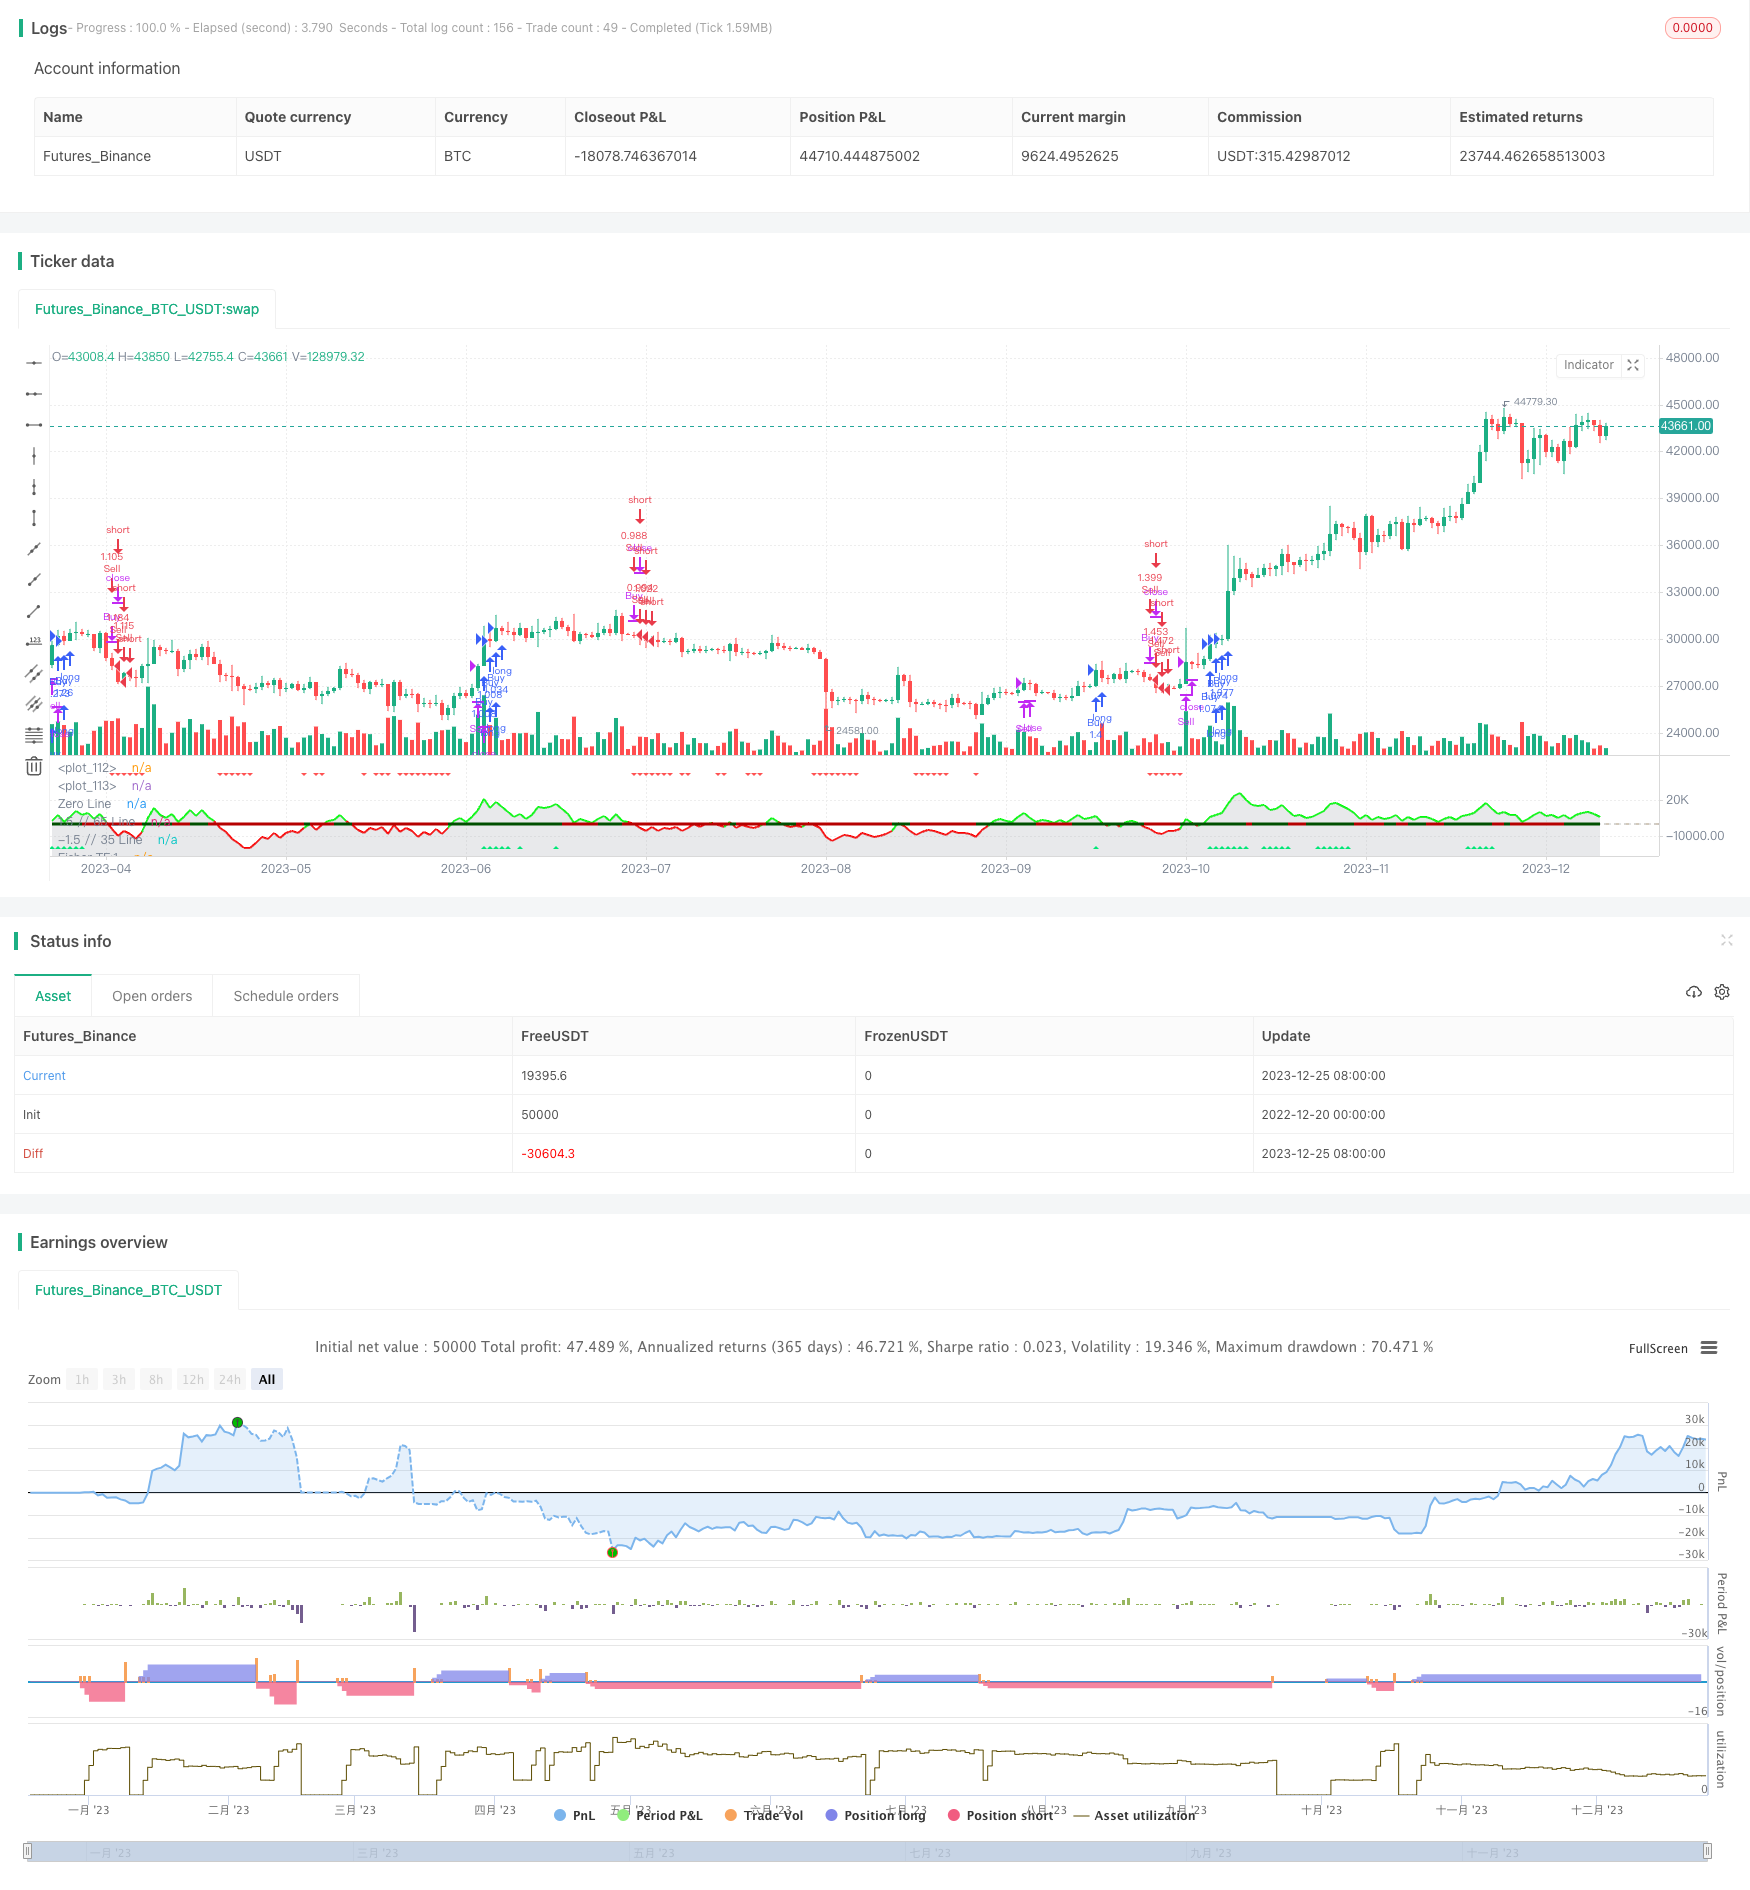
/*backtest
start: 2022-12-20 00:00:00
end: 2023-12-26 00:00:00
period: 1d
basePeriod: 1h
exchanges: [{"eid":"Futures_Binance","currency":"BTC_USDT"}]
*/

//@version=5
//author Sdover0123
strategy(title='FTR, WMA, OBV & RSI Strat', shorttitle='FTR WMA, OBV, RSI',overlay=false, default_qty_type=strategy.percent_of_equity, initial_capital = 100, default_qty_value=100, commission_value = 0.06, pyramiding = 3)
Len = input.int(10, minval=1, group ="Fisher Transform")
mult1 = input.int(1, minval=1, group ="Fisher Transform")
mult2 = input.int(2, minval=1, group ="Fisher Transform")
mult3 = input.int(4, minval=1, group ="Fisher Transform")
mult4 = input.int(8, minval=1, group ="Fisher Transform")
fish(Length, timeMultiplier) =>
    var nValue1 = 0.0
    var nValue2 = 0.0
    var nFish = 0.0
    xHL2 = hl2
    xMaxH = ta.highest(xHL2, Length * timeMultiplier)
    xMinL = ta.lowest(xHL2, Length * timeMultiplier)
    nValue1 := 0.33 * 2 * ((xHL2 - xMinL) / (xMaxH - xMinL) - 0.5) + 0.67 * nz(nValue1[1])
    if nValue1 > .99
        nValue2 := .999
        nValue2
    else if nValue1 < -.99
        nValue2 := -.999
        nValue2
    else
        nValue2 := nValue1
        nValue2
    nFish := 0.5 * math.log((1 + nValue2) / (1 - nValue2)) + 0.5 * nz(nFish[1])
    nFish
Fisher1 = fish(Len, mult1)
Fisher2 = fish(Len, mult2)
Fisher4 = fish(Len, mult3)
Fisher8 = fish(Len, mult4)

rsiLength = input.int(14, minval=1, group ="Moving Averages")
rsiVal = (ta.rsi(close, rsiLength) - 50) / 10
avg = strategy.position_avg_price

wma(source, length) =>
    sum = 0.0
    for i = 0 to length - 1
        sum := sum + source[i] * (length - i)
    wma = sum / (length * (length + 1) / 2)
    wma

wmaLength = input.int(10, "WMA Length", minval=1, group ="Moving Averages")
wmaClose = wma(close, wmaLength)
// Determine if WMA is bullish or bearish
isWmaBullish = wmaClose > wmaClose[1]
isWmaBearish = wmaClose < wmaClose[1]

//OBV
src = close
length = input.int(20, title="OBV Length", group="On-Balance Volume")
obv1(src) =>
    change_1 = ta.change(src)
    ta.cum(ta.change(src) > 0 ? volume : change_1 < 0 ? -volume : 0 * volume)*0.01
os = obv1(src)
obv_osc = os - ta.ema(os, length)
obc_color = (obv_osc > 0 ? color.rgb(0, 255, 8) : color.rgb(255, 0, 0))
plot(obv_osc, color=obc_color, style=plot.style_line, title='OBV-Points', linewidth=2)
plot(obv_osc, color=color.new(#b2b5be, 70), title='OBV', style=plot.style_area)
obvBullFilter = input.float(0.1, minval = 0, maxval = 5, step = 0.01, title ="OBV Bullish minimum value", group="On-Balance Volume")
obvBearFilter = input.float(-0.1, minval = -5, maxval = 0, step = 0.01, title ="OBV Bearish minimum value", group="On-Balance Volume")
obvBull = obv_osc > obvBullFilter
obvBear = obv_osc < obvBearFilter

// Add buy/sell signals
ReversalFilterDown = input.float(-0.7, 'Reversal Down TP Filter', -4, 4, step = 0.01, group = "RSI Level Filters", tooltip = "This is defined by taking the RSI value -50 and /10. When all Fisher lines are changing colour, this will SL/TP the long")
ReversalFilterUp = input.float(0.7, 'Reversal Up TP Filter', -4, 4, step = 0.01, group = "RSI Level Filters", tooltip = "This is defined by taking the RSI value -50 and /10. When all Fisher lines are changing colour, this will SL/TP the short")
RSILevelBuyFilter = input.float(1.66, 'RSI Level Buy Filter', -4, 4, step = 0.01, group = "RSI Level Filters", tooltip = "This is defined by taking the RSI value -50 and /10. Consider negative values")
RSILevelSellFilter = input.float(1, 'RSI Level Sell Filter', -4, 4, step = 0.01, group = "RSI Level Filters", tooltip = "This is defined by taking the RSI value -50 and /10. Consider negative values")
//buys - if breaking out and all Fisher are green and RSI filter value is met
buySignal = Fisher1 > Fisher1[1] and Fisher2 > Fisher2[1] and Fisher4 > Fisher4[1] and Fisher8 > Fisher8[1] and rsiVal > RSILevelBuyFilter and isWmaBullish and obvBull
ReversalUp = Fisher1 > Fisher1[1] and Fisher2 > Fisher2[1] and Fisher4 > Fisher4[1] and Fisher8 > Fisher8[1] and rsiVal > ReversalFilterUp
//sells - if breaking down and all Fisher are green and RSI filter value is met
sellSignal = Fisher1 < Fisher1[1] and Fisher2 < Fisher2[1] and Fisher4 < Fisher4[1] and Fisher8 < Fisher8[1] and rsiVal < RSILevelSellFilter and isWmaBearish and obvBear
ReversalDown = Fisher1 < Fisher1[1] and Fisher2 < Fisher2[1] and Fisher4 < Fisher4[1] and Fisher8 < Fisher8[1] and rsiVal < ReversalFilterDown


// Buy and Sell conditions
if buySignal and time>timestamp(2022, 06, 01, 09, 30) and barstate.isconfirmed
    strategy.close("Sell", comment = "Close Short")
    strategy.entry("Buy", strategy.long, comment = "Long")

if sellSignal and time>timestamp(2022, 06, 01, 09, 30) and barstate.isconfirmed
    strategy.close("Buy", comment = "Close Long")
    strategy.entry("Sell", strategy.short, comment = "Short")

if ReversalDown
    strategy.close("Buy", comment = "Close Long")

if ReversalUp
    strategy.close("Sell", comment = "Close Short")

//Plotting
//Fisher
plot(Fisher1, color=Fisher1 > nz(Fisher1[1]) ? color.green : color.rgb(255, 0, 0), title='Fisher TF:1')
plot(Fisher2, color=Fisher2 > nz(Fisher2[1]) ? color.green : color.rgb(255, 0, 0), title='Fisher TF:1', linewidth=2)
plot(Fisher4, color=Fisher4 > nz(Fisher4[1]) ? #008000 : #b60000, title='Fisher TF:1', linewidth=3)
plot(Fisher8, color=Fisher8 > nz(Fisher8[1]) ? #004f00 : #b60000, title='Fisher TF:1', linewidth=3)
//RSI
plot(rsiVal, color=rsiVal < 0 ? color.purple : color.yellow, linewidth=2, title='RSI')

//WMA
plot(isWmaBullish ? -2 : na, color=color.rgb(76, 175, 79, 20), linewidth=3, style=plot.style_linebr, title="WMA Bullish")
plot(isWmaBearish ? -2 : na, color=color.rgb(255, 82, 82, 20), linewidth=3, style=plot.style_linebr, title="WMA Bearish")

//Buy/Sell Signals
plotshape(buySignal, title='Buy Signal', location=location.bottom, color=color.new(color.lime, 0), style=shape.triangleup, size=size.small)
plotshape(sellSignal, title='Sell Signal', location=location.top, color=color.new(color.red, 0), style=shape.triangledown, size=size.small)

//Orientation
hline(RSILevelBuyFilter, color=color.rgb(25, 36, 99, 20), linestyle=hline.style_dotted, linewidth=2)
hline(RSILevelSellFilter, color=color.rgb(111, 27, 27, 20), linestyle=hline.style_dotted, linewidth=2)
hline(0, color=color.rgb(181, 166, 144, 39), linestyle=hline.style_dashed, linewidth=2, title = "Zero Line")
hline(1.5, color=color.rgb(217, 219, 220, 50), linestyle=hline.style_dotted, linewidth=2, title = "1.5 // 65 Line")
hline(-1.5, color=color.rgb(217, 219, 220, 50), linestyle=hline.style_dotted, linewidth=2, title = "-1.5 // 35 Line")