Strategi terlebih beli dan terlebih jual RSI yang perlahan
Gambaran keseluruhan
Strategi RSI yang perlahan untuk membeli lebih banyak daripada membeli lebih banyak dengan memanjangkan kitaran RSI dan mengurangkan turun naik RSI, yang membuka peluang perdagangan baru. Strategi ini juga berlaku untuk petunjuk teknikal lain seperti MACD.
Prinsip Strategi
Idea utama strategi ini adalah untuk memanjangkan tempoh pusingan RSI, secara default 500 pusingan, dan kemudian meluruskan kurva RSI melalui SMA, dengan pusingan default 250. Ini dapat mengurangkan turun naik kurva RSI dengan ketara, melambatkan kelajuan tindak balas RSI, dan dengan itu menghasilkan peluang perdagangan baru.
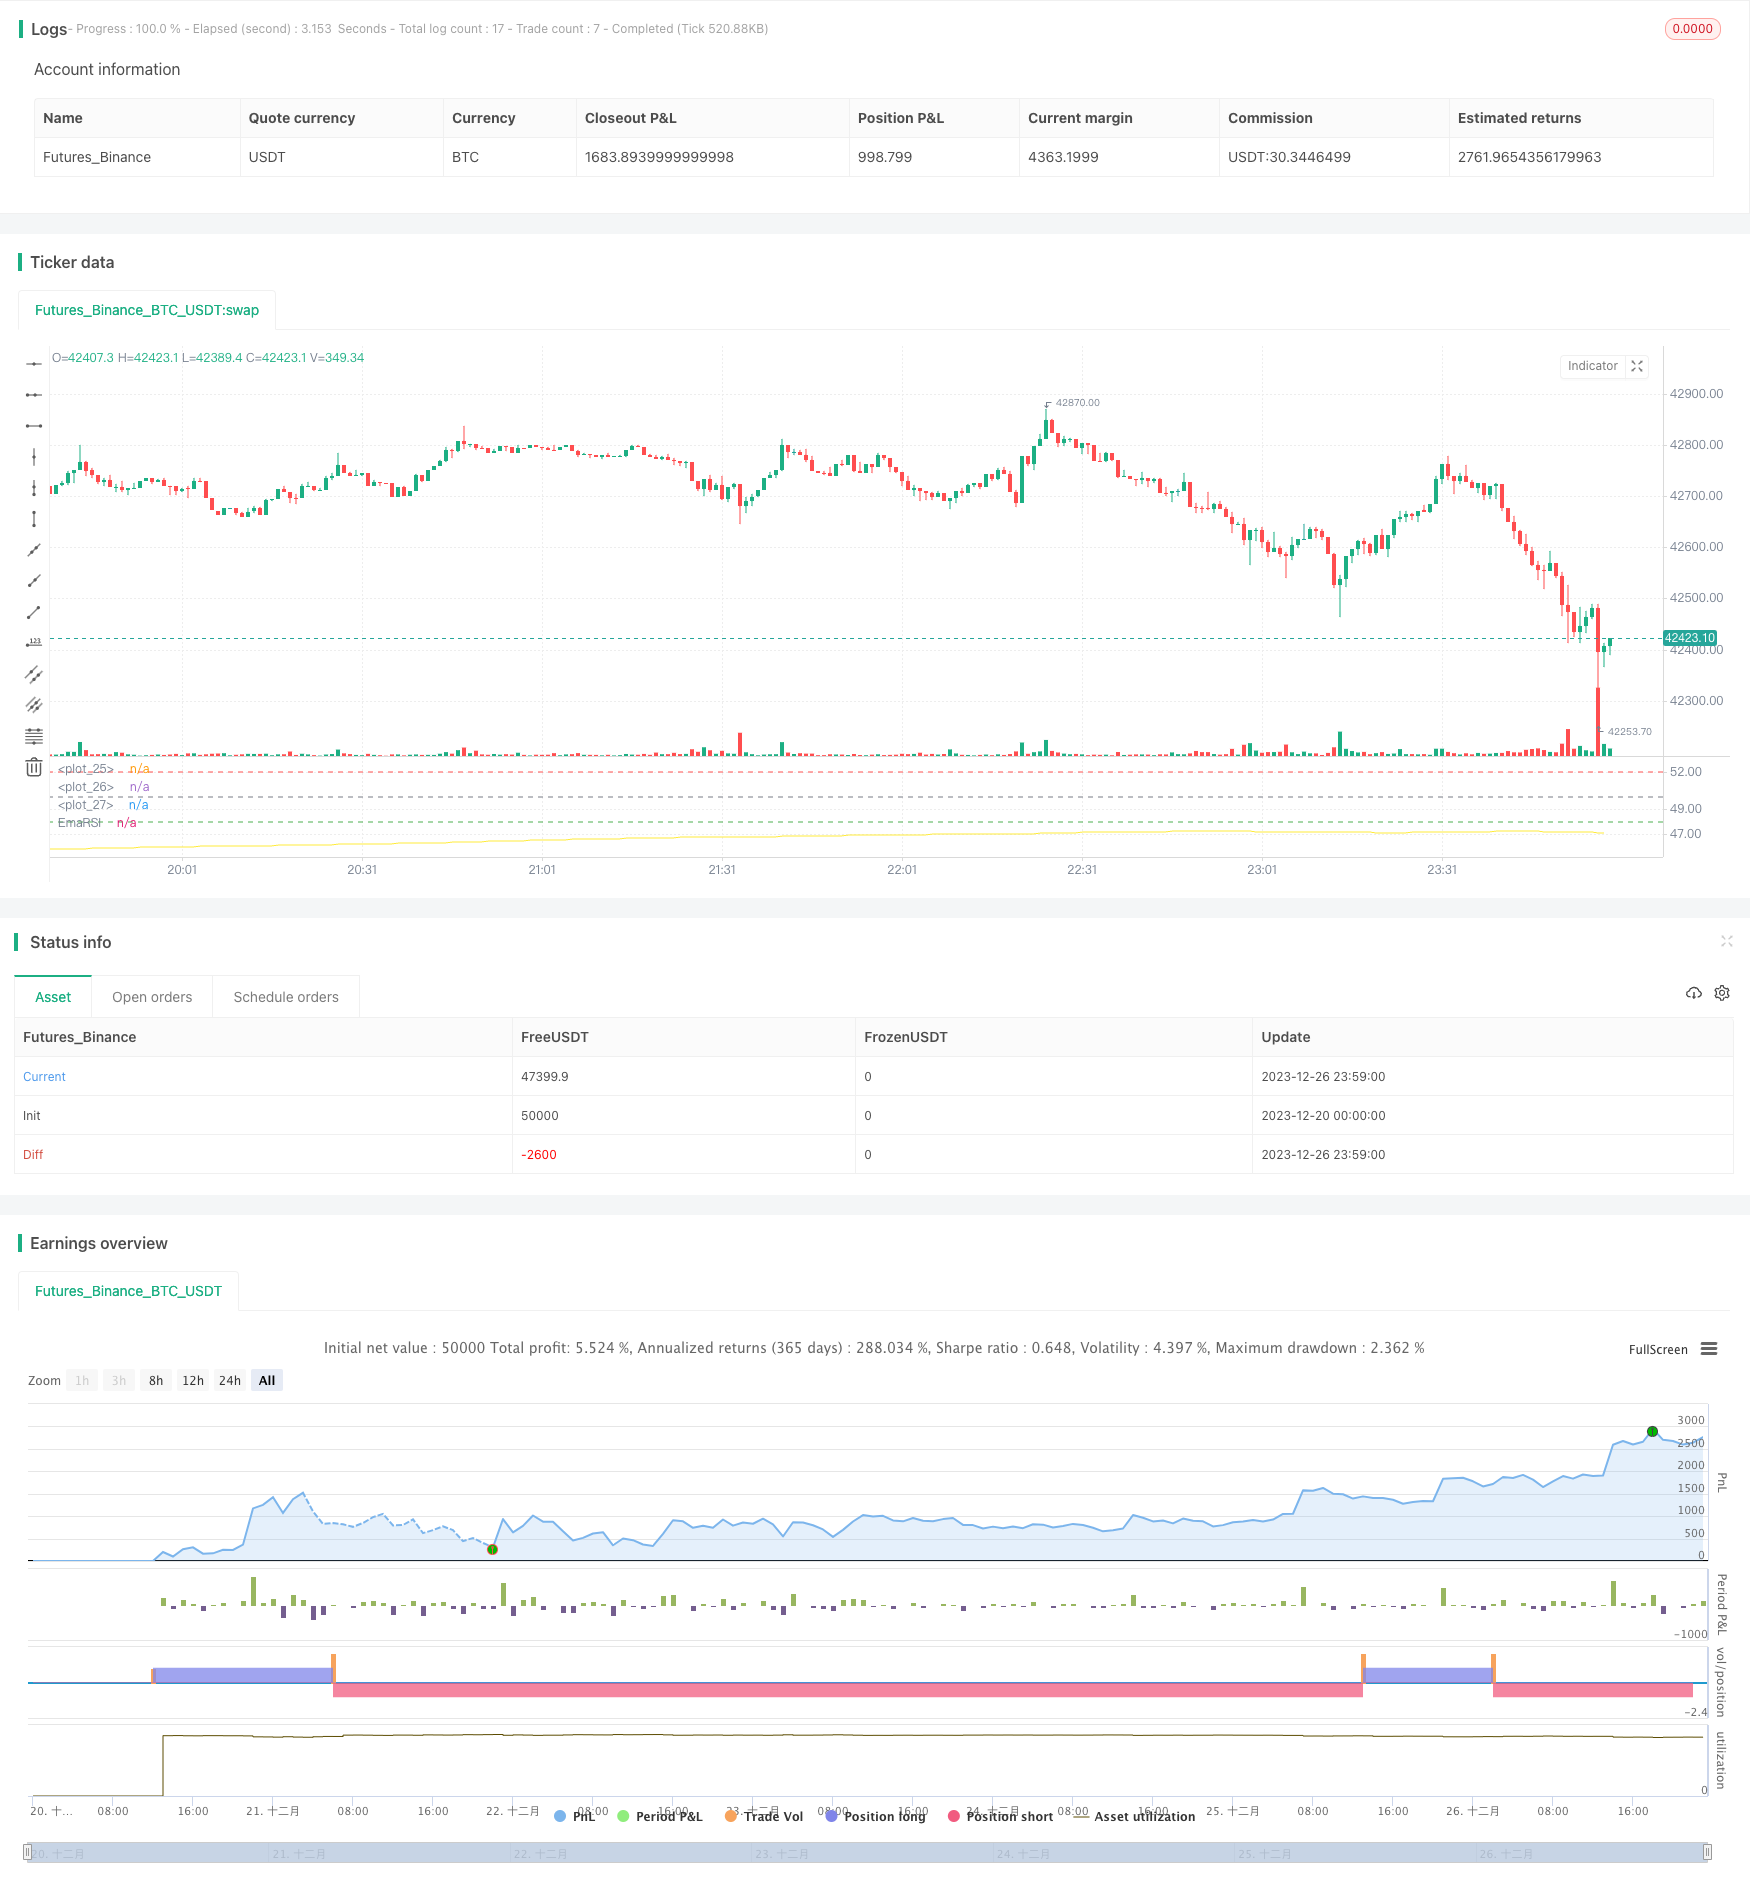
Period penarikan balik yang terlalu lama melemahkan turun naik RSI, oleh itu kriteria untuk menilai overbought dan oversold juga perlu disesuaikan. Strategi menetapkan garis overbought 52 dan garis oversold 48 yang disesuaikan.
Kelebihan Strategik
- Inovatif, membuka jalan baru untuk berdagang dengan memperpanjang kitaran
- Menurunkan isyarat palsu dan meningkatkan kestabilan
- Ciri-ciri yang boleh disesuaikan dengan pasaran yang berbeza
- Benih boleh ditanam untuk meningkatkan kadar hasil
Risiko Strategik
- Tempoh yang terlalu lama boleh menyebabkan kehilangan peluang yang singkat.
- Bersabar menunggu peluang masuk
- Terlalu banyak membeli dan terlalu banyak menjual - tetapan nilai yang tidak betul boleh meningkatkan kerugian
- Risiko untuk dibocorkan
Penyelesaian:
- Memperolehi jangka masa yang lebih pendek dan meningkatkan frekuensi transaksi
- Mengambil langkah-langkah untuk menyebarkan risiko dengan membina gudang secara beratur.
- Mengoptimumkan parameter penurunan nilai untuk menyesuaikan diri dengan keadaan pasaran yang berbeza
- Tetapkan titik henti untuk mengelakkan kerugian besar
Arah pengoptimuman strategi
- Mengoptimumkan parameter RSI untuk mencari kombinasi kitaran terbaik
- Uji parameter kitaran licin SMA yang berbeza
- Mengoptimumkan parameter overbought dan oversold untuk pasaran yang berbeza
- Menambah strategi hentikan kerugian untuk mengawal kerugian tunggal
ringkaskan
Strategi RSI superbeli superjual dengan cara memanjangkan kitaran dan menggunakan penekanan rata-rata untuk menekan turun naik, berjaya membuka pemikiran perdagangan baru. Strategi ini dijangka menghasilkan keuntungan tambahan yang stabil dan cekap dengan parameter yang dioptimumkan dan risiko yang terkawal. Secara keseluruhan, strategi ini sangat inovatif dan bernilai penggunaan.
/*backtest
start: 2023-12-20 00:00:00
end: 2023-12-27 00:00:00
period: 1m
basePeriod: 1m
exchanges: [{"eid":"Futures_Binance","currency":"BTC_USDT"}]
*/


// Wilder was a very influential man when it comes to TA. However, I'm one to always try to think outside the box.
// While Wilder recommended that the RSI be used only with a 14 bar lookback period, I on the other hand think there is a lot to learn from RSI if one simply slows down the lookback period
// Same applies for MACD.
// Every market has its dynmaics. So don't narrow your mind by thinking my source code input levels are the only levels that work.
// Since the long lookback period weakens the plot volatility, again, one must think outside the box when trying to guage overbought and oversold levels.

// Good luck and don't bash me if some off-the-wall FA spurned divergence causes you to lose money.
// And NO this doesn't repaint and I won't answer those who ask.
//@version=4

strategy("SLOW RSI OB/OS Strategy", overlay=false)
price = input(ohlc4, title="Price Source")
len = input(500, minval=1, step=5,  title="RSI Length")
smoother = input(250, minval=1, step=5, title="RSI SMA")
up = rma(max(change(price), 0), len)
down = rma(-min(change(price), 0), len)
rsi = down == 0 ? 100 : up == 0 ? 0 : 100 - (100 / (1 + up / down))
EmaRSI = ema(rsi,smoother)
plot(EmaRSI, title="EmaRSI", style=line, linewidth=1, color=yellow)


OB = input(52, step=0.1)
OS = input(48, step=0.1)
hline(OB, linewidth=1, color=red)
hline(OS,linewidth=1, color=green)
hline(50,linewidth=1, color=gray)


long = change(EmaRSI) > 0 and EmaRSI <= 50 and crossover(EmaRSI, OS)
short = change(EmaRSI) < 0 and EmaRSI >= 50 and crossunder(EmaRSI, OB)


strategy.entry("Long", strategy.long, when=long) //_signal or long) //or closeshort_signal)
strategy.entry("Short", strategy.short, when=short) //_signal or short) // or closelong_signal)

// If you want to try to play with exits you can activate these!

//closelong = crossunder(EmaRSI, 0) //or crossunder(EmaRSI, OS)
//closeshort = crossover(EmaRSI, 0) //or crossover(EmaRSI, OB)

//strategy.close("Long", when=closelong)
//strategy.close("Short", when=closeshort)