Strategi pengoptimuman stop loss bergerak dinamik berdasarkan strategi jaring ikan
Gambaran keseluruhan
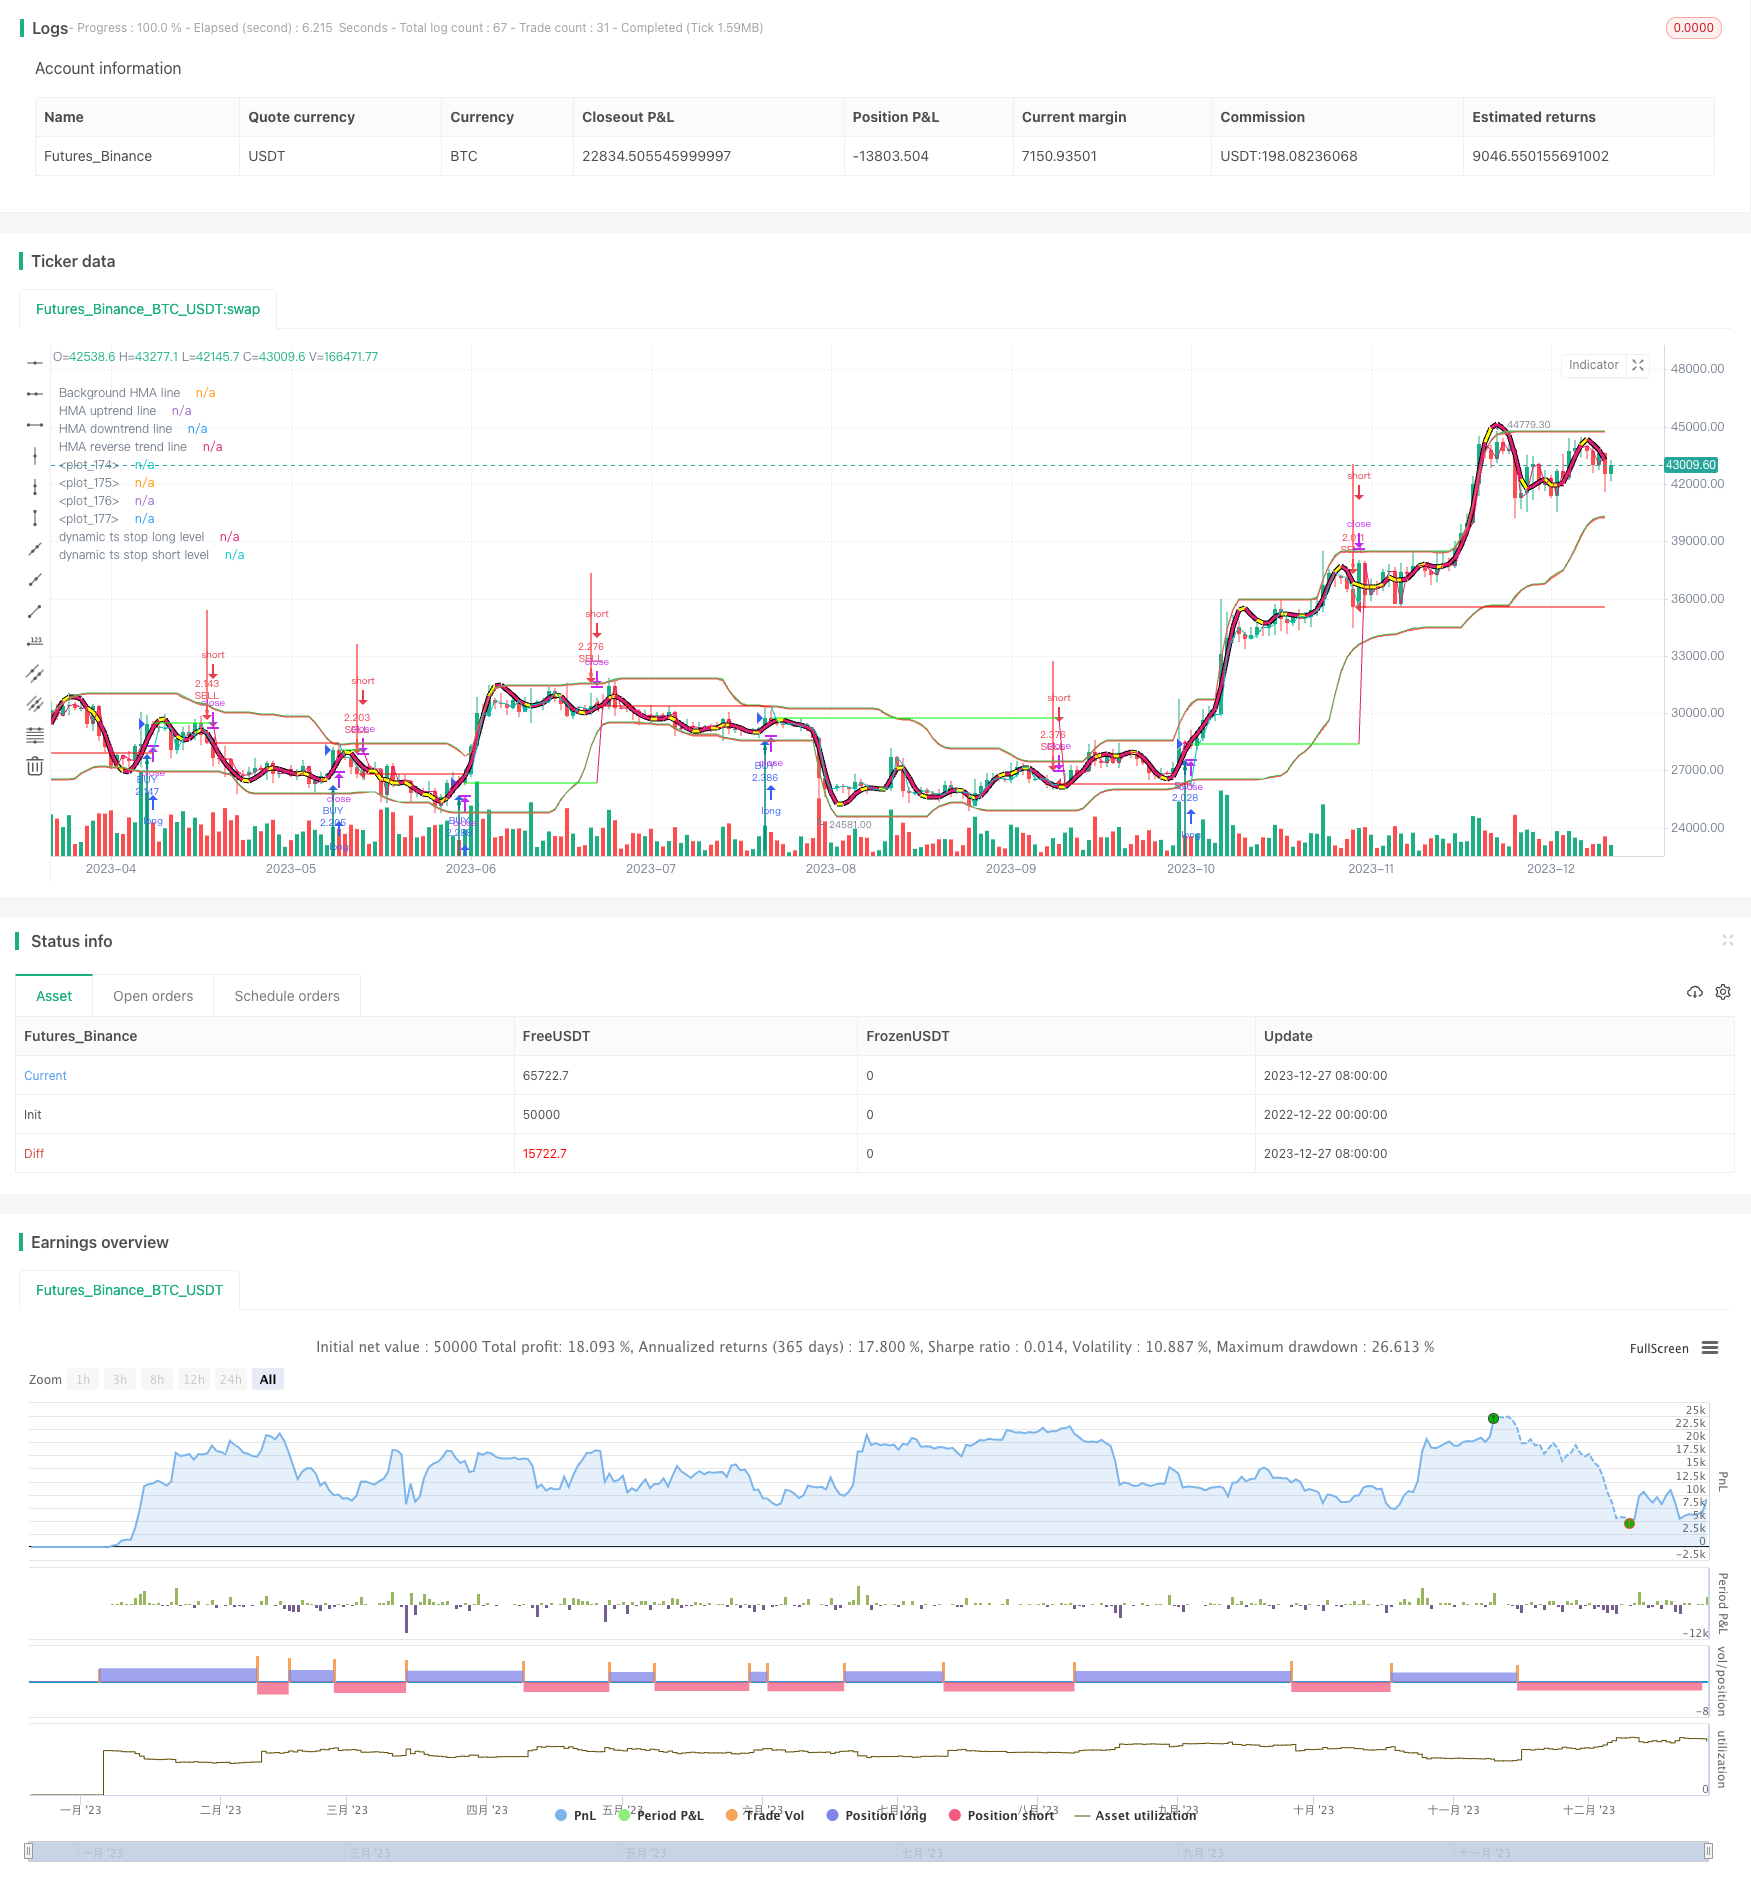
Idea teras strategi ini adalah menggabungkan strategi penangkapan ikan dan mekanisme berhenti bergerak dinamik, untuk mencapai penarikan berhenti yang lebih cekap. Strategi penangkapan ikan menilai trend dan kedudukan pasaran melalui petunjuk K-line, secara dinamik menentukan masa membeli dan menjual.
Prinsip
Strategi ini berdasarkan kepada beberapa modul berikut:
- Modul penunjuk jaring
Menggunakan tekanan Fisher dan Stoch untuk mengira indeks jaring ikan, menilai trend pasaran dan titik jual beli.
- Modul Hentikan Kerosakan Dinamik
Mengikut ATR dan RSI, stop loss dinamika dikira dan stop loss dinamika dikesan.
- Modul Tracking Stop Loss Mobile
Tetapkan titik perpindahan hentian tetap dan keluar dari kedudukan apabila harga mencapai titik hentian
Analisis kelebihan
Kelebihan utama strategi ini adalah keupayaan mengawal risiko yang sangat baik. Mekanisme hentian kerugian dinamik dapat menetapkan lebar hentian yang sesuai mengikut tahap turun naik pasaran, dengan berkesan mengelakkan kerugian yang disebabkan oleh slippage yang terlalu besar, dan dapat mengikuti trend dengan lebih baik daripada hentian hentian tetap. Selain itu, indikator jala ikan dapat menilai masa pembelian dan penjualan dengan tepat dan dapat menyaring sebahagian daripada perdagangan bising.
Analisis risiko
Risiko utama dalam strategi ini adalah bahawa penyetempatan titik berhenti yang tidak betul boleh menyebabkan penarikan yang terlalu radikal. Selain itu, jika penyetempatan parameter yang terlalu radikal digunakan, ia juga boleh menyebabkan perdagangan whipsaw terlalu kerap. Untuk mengurangkan risiko ini, parameter harus dipilih dengan munasabah dan mengelakkan penyetempatan pergerakan yang terlalu besar.
Arah pengoptimuman
Ruang untuk pengoptimuman dalam strategi ini adalah tertumpu kepada aspek-aspek berikut:
Mengoptimumkan parameter penunjuk jaring untuk mencari kombinasi parameter yang lebih baik untuk menilai trend;
Mengoptimumkan parameter hentian dinamik untuk mencari hentian yang lebih seimbang;
Menambah modul pengurusan kedudukan berdasarkan kadar turun naik, menyesuaikan kedudukan mengikut tahap turun naik pasaran.
Dengan mencari parameter dan mengoptimumkan peraturan, strategi ini dapat memperoleh pulangan disesuaikan risiko yang lebih tinggi.
ringkaskan
Strategi ini menggunakan indikator jaring ikan dan teknik hentian dinamik secara komprehensif, yang dapat menilai pergerakan pasaran dengan lebih tepat, membantu membuat keputusan pada masa yang tepat, dan dapat menyesuaikan amplitudo hentian secara dinamik, mengawal risiko dengan berkesan. Dengan perluasan modul dan pengoptimuman parameter yang berterusan, strategi ini dapat menjadi kerangka strategi yang berkesan yang boleh digunakan dalam jangka masa panjang.
/*backtest
start: 2022-12-22 00:00:00
end: 2023-12-28 00:00:00
period: 1d
basePeriod: 1h
exchanges: [{"eid":"Futures_Binance","currency":"BTC_USDT"}]
*/

//@version=4
strategy("IFTS+TS Strategy Overlay ", overlay=true, pyramiding = 0, calc_on_order_fills = false, commission_type =  strategy.commission.percent, commission_value = 0.0454, default_qty_type = strategy.percent_of_equity, default_qty_value = 100)

//INPUTS
stochlength=input(19, "Stoch & ATR Length")
wmalength=input(4, title="Smooth")
ul = input(82.05,step=0.01, title="UP line")
dl = input(19,step=0.01, title="DOWN line")
uts = input(true, title="Use trailing stop")
rts = input(false, title="Re-enter after trailing stop")
tsi = input(title="trailing stop actiation pips",defval=245)
tso = input(title="trailing stop offset pips",defval=20)
udts = input(true, title="Use dynamic trailing stop start")
mpl2 = input(68.3,step=0.05, title="Multiplier for Dynamic TS start X*ATR")
udto = input(true, title="Use dynamic trailing stop offset")
mpl = input(1,step=0.01, title="Multiplier for Dynamic TS offset X*ATR")
occ = input(1, title="Occurancy for dynamic TS")
useCurrentRes = input(true, title="Use Current Chart Resolution?")
resCustom = input(title="Timeframe",defval="30")
hma = input(title="Plot Hull MA", defval=true)
pl = input(title="Plot all", defval=true)

//CALCULATIONS
v1=0.1*(stoch(close, high, low, stochlength)-50)
v2=wma(v1, wmalength)
k1=(exp(2*v2)-1)/(exp(2*v2)+1)*50+50
res = useCurrentRes ? timeframe.period : resCustom
k=security(syminfo.tickerid, res, k1, barmerge.lookahead_off)

//CALCULATIONS HULL MA
n=stochlength/2
n2ma=2*wma(close,round(n/2))
nma=wma(close,n)
diff=n2ma-nma
sqn=round(sqrt(n))
n2ma1=2*wma(close[1],round(n/2))
nma1=wma(close[1],n)
diff1=n2ma1-nma1
sqn1=round(sqrt(n))
n1=wma(diff,sqn)
n2=wma(diff1,sqn)
n3=n1-(n1*-1)
n4=n1+(n1)

//CALCULATIONS FOR BUY/SELL LEVELS
//stc=(stoch(close, high, low, stochlength))

//v3=0.1*(stoch(low, low, low, stochlength)-50)
//v4=wma(v3, wmalength)
//k3=(exp(2*v4)-1)/(exp(2*v4)+1)*50+50
//k2=security(syminfo.tickerid, res, k3, barmerge.lookahead_off)
//stl=(stoch(low, low, low, stochlength))

//v5=0.1*(stoch(high, high, high, stochlength)-50)
//v6=wma(v5, wmalength)
//k5=(exp(2*v6)-1)/(exp(2*v6)+1)*50+50
//k4=security(syminfo.tickerid, res, k5, barmerge.lookahead_off)
//sth=(stoch(high, high, high, stochlength))

//difc=k-stc
//difl=k2-stl+difc
//difh=k4-sth+difc

hg1=wma(highest(stochlength),wmalength)//-highest(stochlength)*(difh/10000)
hg=security(syminfo.tickerid, res, hg1, barmerge.lookahead_off)
hgob=hg-hg*((100-ul)/10000)
lw1=wma(lowest(stochlength),wmalength)//-lowest(stochlength)*(difl/10000)
lw=security(syminfo.tickerid, res, lw1, barmerge.lookahead_off)
lwos=lw+lw*(dl/10000)

////CONDITIONS CROSS
sell = crossunder(k,ul)? 1 : 0
buy = crossover(k,dl)? 1 : 0

////COUNT BARCOLORS
var countred = 0
if sell == 1
    countred := 1
if buy == 1
    countred := 0

var countgreen = 0
if buy == 1
    countgreen := 1
if sell == 1
    countgreen := 0

////CONDITIONS COUNT BARCOLORS
long=countgreen[1]==0 and countgreen==1 ? 1 : 0
short=countred[1]==0 and countred==1 ? 1 : 0

////COLORS
//STOCH
col = k>=k[1] ? color.aqua : color.red
col1 = countred[2]==1 ? na : #00FF00
col2 = countgreen[2]==1 ? na : #FF0000
col3 = countred[2]==1 ? na : color.yellow
col4 = countgreen[2]==1 ? na : color.yellow
//HMA
dif = n1[1]-n3
dif1 = dif>dif[1] and dif[1]>dif[2] ? na: #00FF00 //uptrend - green
dif3 = n4-n1[1]
dif2 = dif3>dif3[1] and dif3[1]>dif3[2] ? na: #FF0000  //downtrend - red
dif4 = (dif>dif[1] and dif[1]>dif[2]) == (dif3>dif3[1] and dif3[1]>dif3[2]) ? #FFFF00: na //trend change - yellow

////PLOTS CALCULATIONS DYNAMIC TS
dtso1 = sma(atr(stochlength),2)*100
dtso=security(syminfo.tickerid, "1", dtso1,barmerge.lookahead_on)*mpl
dtsi = rsi(atr(stochlength),stochlength)/mpl2*tsi
dtsiv = valuewhen(long or short, dtsi, occ)
dtsov = valuewhen(long or short, dtso, occ)
//DYNAMIC TS START
dtsil1 = countred[2]==1 and pl and uts and udts? open+(dtsiv/100) : na
dtsis1 = countgreen[2]==1 and pl and uts and udts? open-(dtsiv/100) : na
dtsil = countred[2]==1 and pl and uts and udts? open+(dtsiv/100) : fixnan(dtsil1[1])
dtsis = countgreen[2]==1 and pl and uts and udts? open-(dtsiv/100) : fixnan(dtsis1[1])
//DYNAMIC TS OFFSET+START
dtsol1 = countred[2]==1 and pl and uts and udto? dtsil-(dtsov/100) : na
dtsos1 = countgreen[2]==1 and pl and uts and udto? dtsis+(dtsov/100) : na
dtsol = countred[2]==1 and pl and uts and udto? dtsil-(dtsov/100) : fixnan(dtsol1[1])
dtsos = countgreen[2]==1 and pl and uts and udto? dtsis+(dtsov/100) : fixnan(dtsos1[1])
//CONST TS START
tsil1 = countred[2]==1 and pl and uts and not udts? open+(tsi/100) : na
tsis1 = countgreen[2]==1 and pl and uts and not udts? open-(tsi/100) : na
tsil = countred[2]==1 and pl and uts and not udts? open+(tsi/100) : fixnan(tsil1[1])
tsis = countgreen[2]==1 and pl and uts and not udts? open-(tsi/100) : fixnan(tsis1[1])
//CONST TS START + DYNAMIC TS OFFSET
tsol21 = countred[2]==1 and pl and uts and not udts and udto? open+(tsi/100)-(dtsov/100) : na
tsos21 = countgreen[2]==1 and pl and uts and not udts and udto? open-(tsi/100)+(dtsov/100) : na
tsol2 = countred[2]==1 and pl and uts and not udts and udto? open+(tsi/100)-(dtsov/100) : fixnan(tsol21[1])
tsos2 = countgreen[2]==1 and pl and uts and not udts and udto? open-(tsi/100)+(dtsov/100) : fixnan(tsos21[1])
//CONST TS OFFSET
tsol1 = countred[2]==1 and pl and uts and not udto? tsil-(tso/100) : na
tsos1 = countgreen[2]==1 and pl and uts and not udto? tsis+(tso/100) : na
tsol = countred[2]==1 and pl and uts and not udto? tsil-(tso/100) : fixnan(tsol1[1])
tsos = countgreen[2]==1 and pl and uts and not udto? tsis+(tso/100) : fixnan(tsos1[1])

//////PLOTS
////LABELS
//TS LABELS
// ltsos = (short==1) and udto and pl? label.new(bar_index, high[1]+close*0.006,  text="os "+tostring(round(dtsov)), color=color.white, size=size.small) : na
// ltsol = (long==1) and udto and pl? label.new(bar_index, low[1]-close*0.006,  text="os "+tostring(round(dtsov)), color=color.white, size=size.small, style=label.style_labelup) : na
// ltsis = (short==1) and udts and pl? label.new(bar_index, high[1]+close*0.008, text="st "+tostring(round(dtsiv)), color=color.white, size=size.small) : na
// ltsil = (long==1) and udts and pl? label.new(bar_index, low[1]-close*0.008,  text="st "+tostring(round(dtsiv)), color=color.white, size=size.small, style=label.style_labelup) : na
//STOCH LABEL
//lk = k>ul and pl? label.new(bar_index, high, text=tostring(round(k)), color=col, size=size.small) :na
//lk2 = k<dl and pl? label.new(bar_index, high, text=tostring(round(k)), color=col, size=size.small) :na
//lk3 = k>dl and k<ul and pl? label.new(bar_index, high, text=tostring(round(k)), color=color.white, size=size.small) :na
//label.delete(lk[1])
//label.delete(lk2[1])
//label.delete(lk3[1])

//ltson = udto==true and pl? label.new(bar_index, 75, text="os "+tostring(round(dtso)), color=color.yellow, size=size.small) :na
//label.delete(ltson[1])
//ltsin = udts==true and pl? label.new(bar_index, 0, text="st "+tostring(round(dtsi)), color=color.yellow, size=size.small) :na
//label.delete(ltsin[1])

//DYNAMIC TS LINES
plot(dtsil, color=col1, transp = 0, title = "dynamic ts stop long level")
plot(dtsis, color=col2, transp = 0, title = "dynamic ts stop short level")
plot(dtsol, color=col3, transp = 30, title = "dynamic ts offset long level")
plot(dtsos, color=col4, transp = 30, title = "dynamic ts offset short level")
plot(tsol2, color=col3, transp = 30, title = "const start + dynamic ts offset long level")
plot(tsos2, color=col4, transp = 30, title = "const start + dynamic ts offset short level")
//TS LINES
plot(tsil, color=col1, transp = 0, title = "const ts stop long level")
plot(tsis, color=col2, transp = 0, title = "const ts stop short level")
plot(tsol, color=col3, transp = 30, title = "const ts stop offset long level")
plot(tsos, color=col4, transp = 30, title = "const ts stop offset short level")
//ARROWS
plotarrow(pl==true? long : na, colorup = color.teal, transp=0, title = "buy arrow")
plotarrow(pl==true? -short : na, colordown = color.red, transp=0, title = "sell arrow")
//HIGH/LOW
p1 = plot(pl==true?hg : na, color=color.green, transp=100, editable=false)
p2 = plot(pl==true?lw : na, color=color.red, transp=100, editable=false)
p3 = plot(pl==true?lwos : na, color=color.green, linewidth=1, transp=100, editable=false)
p4 = plot(pl==true?hgob : na, color=color.red, linewidth=1, transp=100, editable=false)
fill(p1,p4, color=color.green, transp=75, title = "highest price levels")
fill(p2,p3, color=color.red, transp=75, title = "lowest price levels")
//HMA
mab=plot(hma and pl ? n1 : na,color=#000000, linewidth=5, transp=0, title = "Background HMA line") //black
ma=plot(hma and pl ? n1 : na,color=dif1, linewidth=3, transp=10, title = "HMA uptrend line") //green
ma2=plot(hma and pl ? n1 : na,color=dif2, linewidth=3, transp=20, title = "HMA downtrend line")//red
ma3=plot(hma and pl ? n1 : na,color=dif4, linewidth=3, transp=10, title = "HMA reverse trend line") //yellow
//LINES
// ldl = long[1]==1 and uts and udts? line.new(bar_index, high, bar_index, dtsil, color=#00FF00, width = 1) : na
// lds = short[1]==1 and uts and udts? line.new(bar_index, high, bar_index, dtsis, color=#FF0000, width = 1) : na
// ll = long[1]==1 and uts and not udts? line.new(bar_index, high, bar_index, tsil, color=#00FF00, width = 1) : na
// ls = short[1]==1 and uts and not udts? line.new(bar_index, high, bar_index, tsis, color=#FF0000, width = 1) : na

////STRATEGY
strategy.entry("BUY", strategy.long, when = buy)
strategy.entry("SELL", strategy.short, when = sell)

if (rts)
    strategy.entry("BUY", strategy.long, when = countgreen==1 and dif1==#00FF00)
    strategy.entry("SELL", strategy.short, when = countred==1 and dif2==#FF0000)

if  (uts)
    strategy.exit("Close BUY with TS","BUY", trail_points = tsi, trail_offset = tso)
    strategy.exit("Close SELL with TS","SELL", trail_points = tsi, trail_offset = tso)

    if  (udto)
        strategy.exit("Close BUY with TS","BUY", trail_points = tsi, trail_offset = dtsov)
        strategy.exit("Close SELL with TS","SELL", trail_points = tsi, trail_offset = dtsov)

    if  (udts)
        strategy.exit("Close BUY with TS","BUY", trail_points = dtsiv, trail_offset = tso)
        strategy.exit("Close SELL with TS","SELL", trail_points = dtsiv, trail_offset = tso)

    if  (udto and udts)
        strategy.exit("Close BUY with TS","BUY", trail_points = dtsiv, trail_offset = dtsov)
        strategy.exit("Close SELL with TS","SELL", trail_points = dtsiv, trail_offset = dtsov)